
Figure 3.
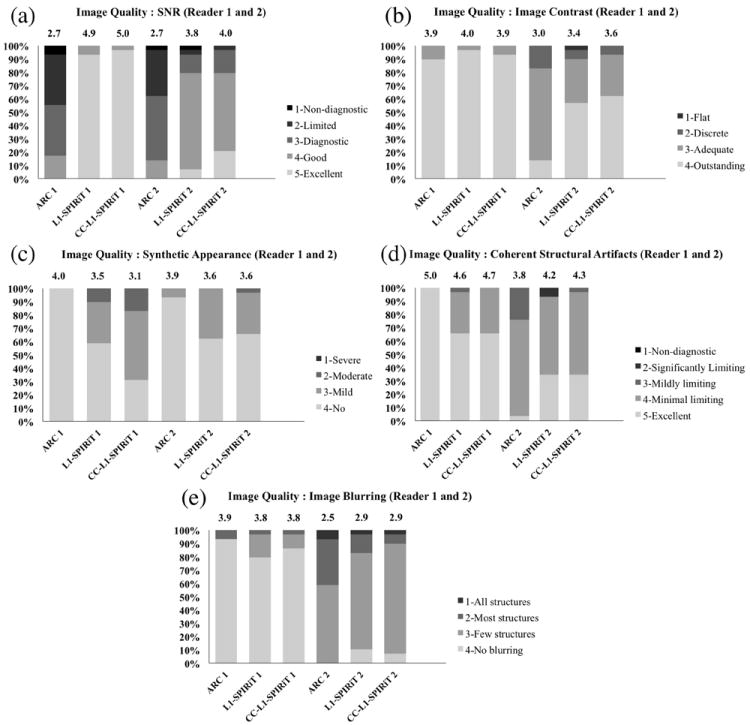
Representative results of overall image quality assessments for ARC, L1-SPIRiT and CC-L1-SPIRiT reconstructions for Reader 1 and Reader 2: (a) Qualitative SNR; (b) Image contrast; (c) Synthetic appearance; (d) Coherent structural artifacts; and (e) Image blurring. Each color bar represents the percentage of number of the cases with the same score. The mean score of each reconstruction is shown on top of the color bar.