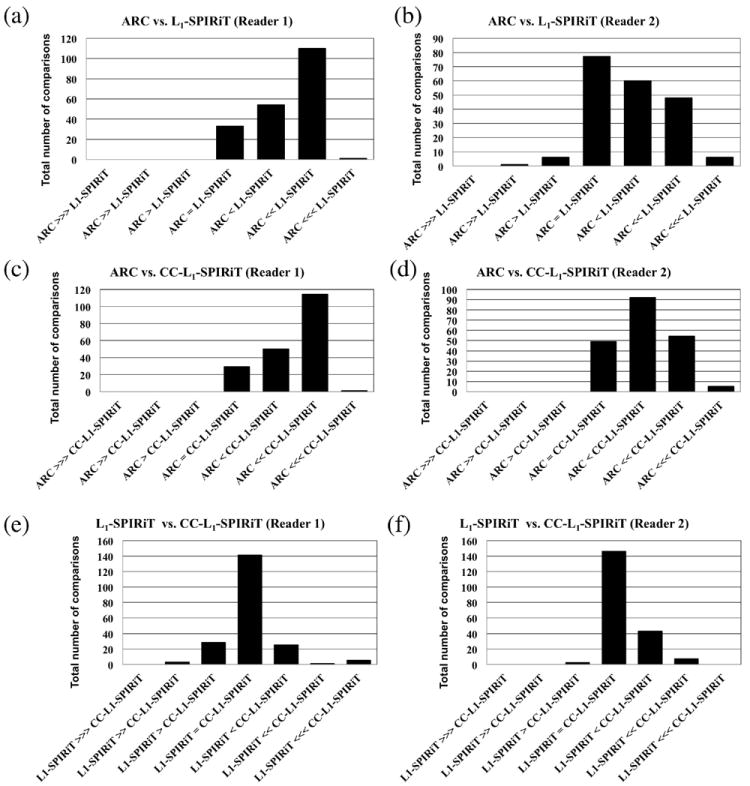
Figure 5.

Representative results of the paired assessment of structural delineation based on the scoring criteria in Tab. 4. Bar graphs were generated based on the comparisons of all seven anatomical structures. The scores of the comparisons (-3, -2, -1, 0, 1, 2, 3) were represented by (⋙, ≫, >, =, <, ≪, ⋘) respectively in the bar graph. For example, “ARC > L1-SPIRiT” means that there was aesthetic improvement in ARC than L1-SPIRiT. The comparison results between ARC and L1-SPIRiT are shown in (a) and (b) for reader 1 and reader 2 respectively. The comparison results between ARC and CC-L1-SPIRiT are shown in (c) and (d). The comparison results between L1-SPIRiT and CC-L1-SPIRiT are shown in (e) and (f).
