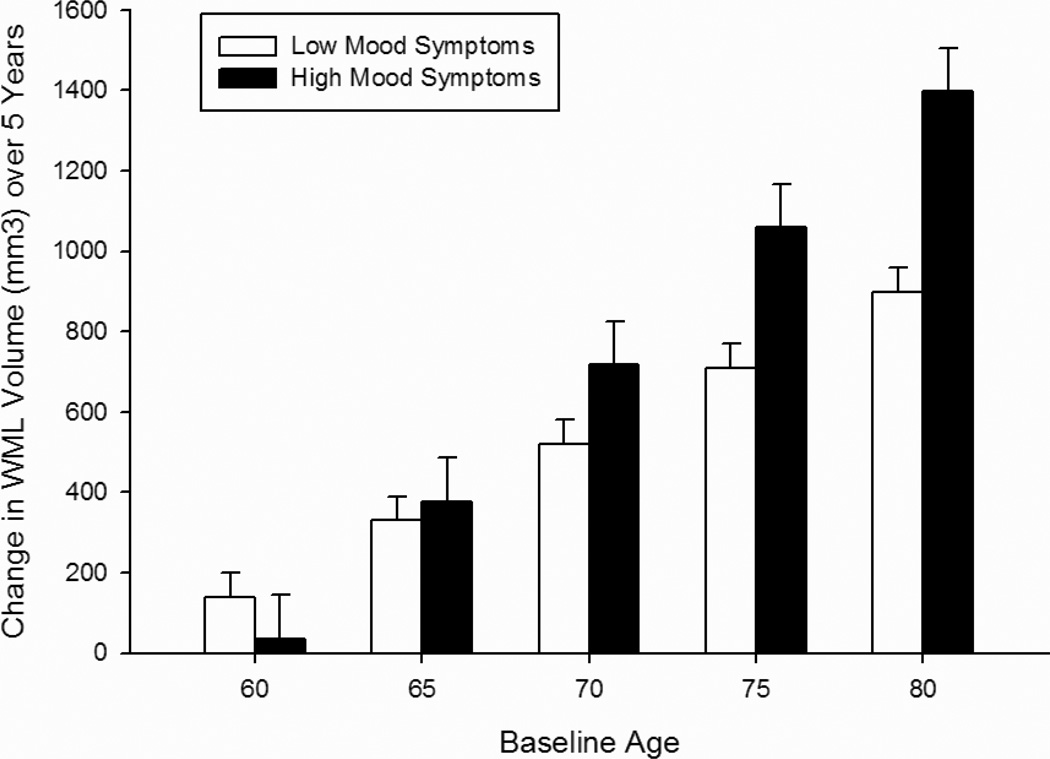
Figure 2.
Change in white matter lesion volume over 5 years as a function of the Depressed Mood Subscale of the Center for Epidemiologic Studies Depression Scale (CES-D). Bars represent difference scores computed from estimated values at baseline and in year 5. Low Mood Symptoms = lower 3 quartiles of scores (0–1); High Mood Symptoms = upper quartile of scores (2+). Note: Age groupings are for visual representation; age was analyzed as continuous measures in all statistical analyses.

