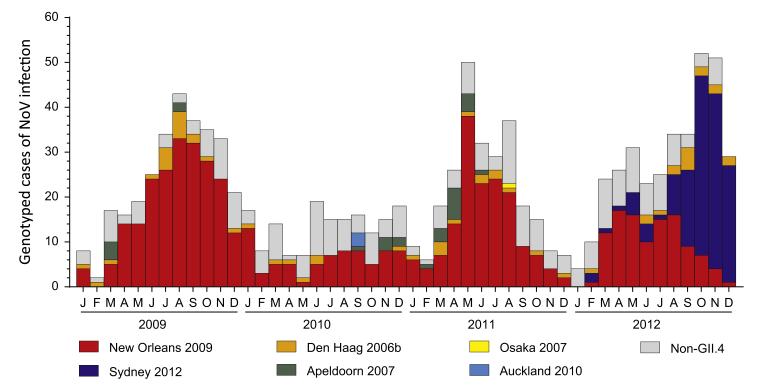
Fig. 2. Prevalence of circulating norovirus genotypes in the Oceania region.
The genotyping results for Australia and New Zealand were combined then plotted by month between 2009 and 2012 to highlight the cause of each norovirus epidemic as well as the shift in prevalence between New Orleans 2009 and Sydney 2012 that occurred during late 2012. The prevalence of each GII.4 variants is shown with non-GII.4s grouped separately and coloured according to the key provided.

