
Fig. 2.
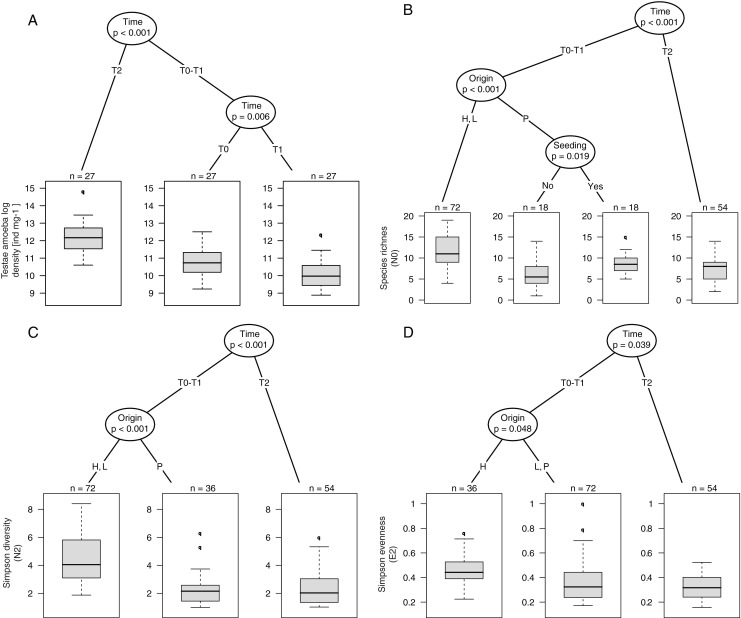
Conditional inference trees assessing the impact of community manipulations (seeded vs. non-seeded; Seeding), transplantations from different habitats (hummocks, lawns and pools; Origin), to different local hydric conditions (dry, moist, wet; Local conditions) and seasonal changes (T0, August 2008; T1, May 2009; and T2, August 2009) on testate amoeba density and diversity (i.e. species richness, Simpson diversity and evenness) in the experimental plots of Le Russey bog, French Jura. p values are given below variable names. Boxplots show the distribution of response variables per groups; n indicates the number of observations within each group