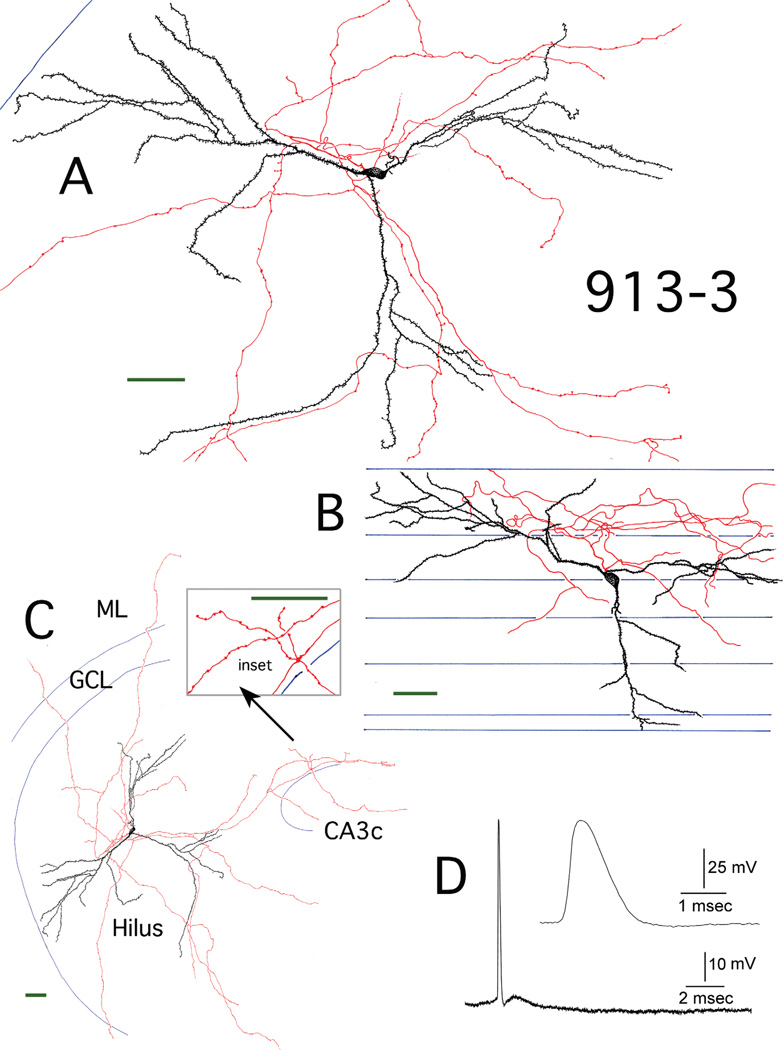
Figure 3.
Reconstruction of hilar EGC 913-3. A: Camera lucida reconstruction of the soma, dendrites (black), and local axons (red) in the transverse plane. B: Longitudinal view of the cell generated from rotating and tracing the Neurolucida reconstruction. Blue lines mark the borders of individual sections. C: A transverse view of the complete dendritic and axonal camera lucida reconstruction. Blue lines mark subfield boundries. Inset: mossy fiber boutons at higher magnification. ML, molecular layer; GCL, granule cell layer. D: Recording from hilar EGC 913-3. A spontaneous AP is shown, which was evoked when the cell was depolarized to threshold. Inset: the AP at higher gain. Scale bars (green) = 50 µm.

