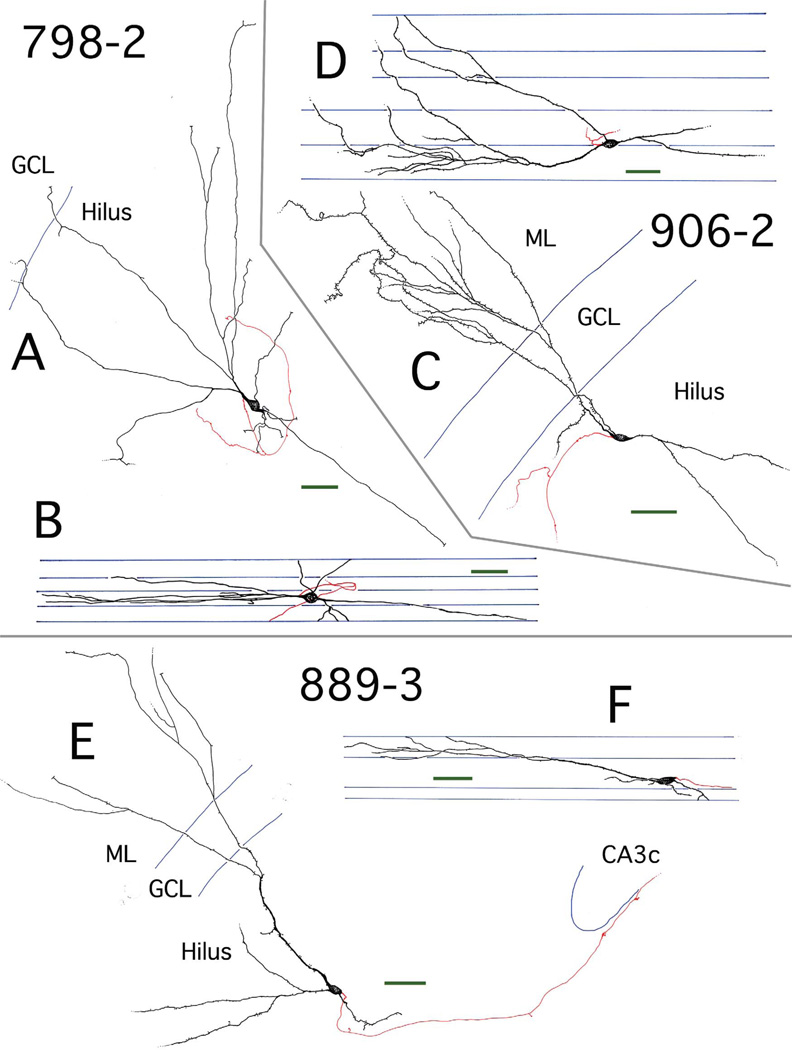
Figure 5.
Transverse and longitudinal views of three hilar EGC reconstructions. A,B: Reconstruction of hilar EGC 798-2, presented in transverse (A) and longitudinal (B) views. Dendrites (black) were almost exclusively restricted to the hilus. Axons are shown in red. C,D: Reconstruction of hilar EGC 906-2, presented in transverse (C) and longitudinal (D) views. Dendrites (black) were located in both the hilus and ML. Axons are shown in red. E,F: Reconstruction of hilar EGC 889-3 from a nonepileptic control rat, presented in transverse (E) and longitudinal (F) views. There were dendrites (black) in both the hilus and ML. Axons are shown in red. Subfield boundaries and section borders are shown in blue. Scale bars (green) = 50 µm. GCL, granule cell layer.

