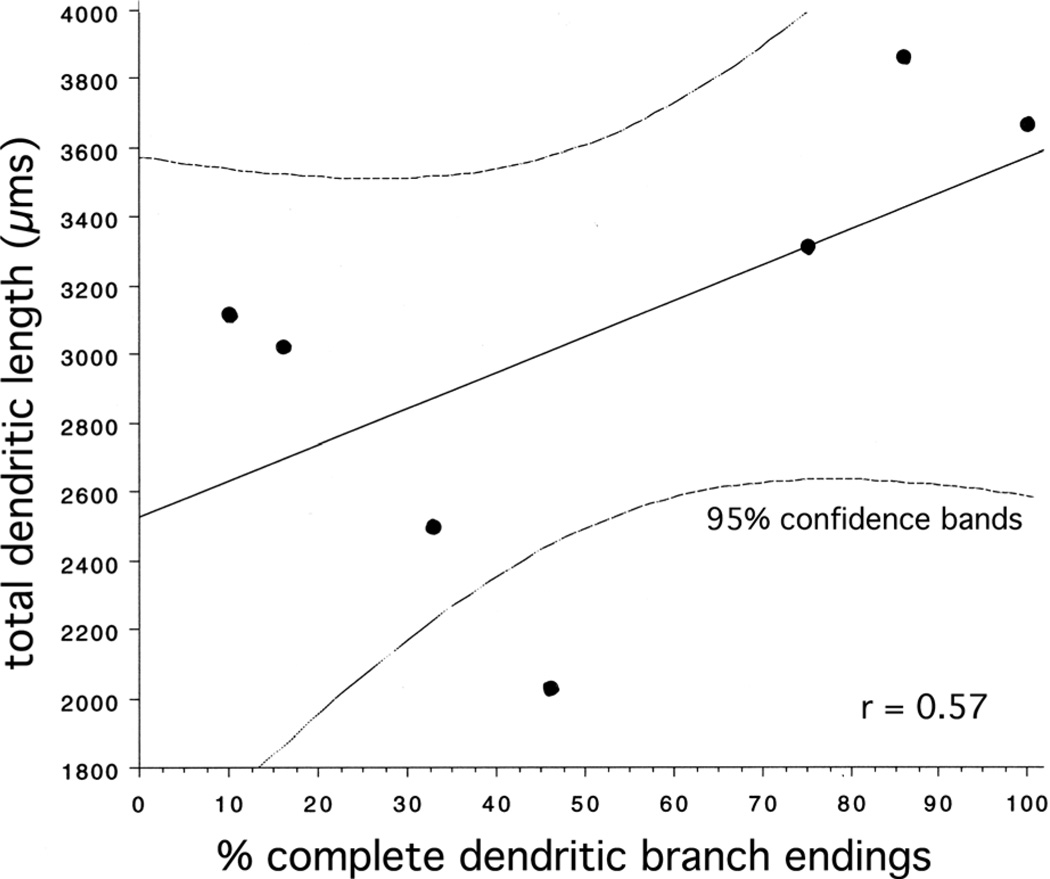
Figure 7.
Plot of EGC (n = 6 epileptic and 1 control) total dendritic length per cell, in µm, vs. the percentage of dendritic endings that were complete (i.e., which did not end at a cut surface). These values were correlated (r = 0.57), such that a regression line had a y-intercept of 3,600 µm, very close to the mean value for GC layer GCs (3,700 ± 200 µm). Dashed lines reflect 95% confidence intervals.

