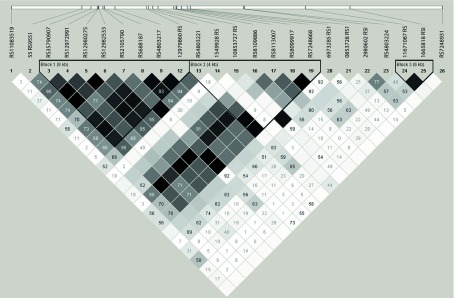
Figure 1. Analysis of Pairwise Linkage Disequilibrium (LD) Plot of IFN-λ Region.

The linkage disequilibrium between the 17 SNPs in three LD blocks is shown. The red coloured squares represent r2 = 1.0 and blue coloured squares represent r2 ≤ 0.01.

The linkage disequilibrium between the 17 SNPs in three LD blocks is shown. The red coloured squares represent r2 = 1.0 and blue coloured squares represent r2 ≤ 0.01.