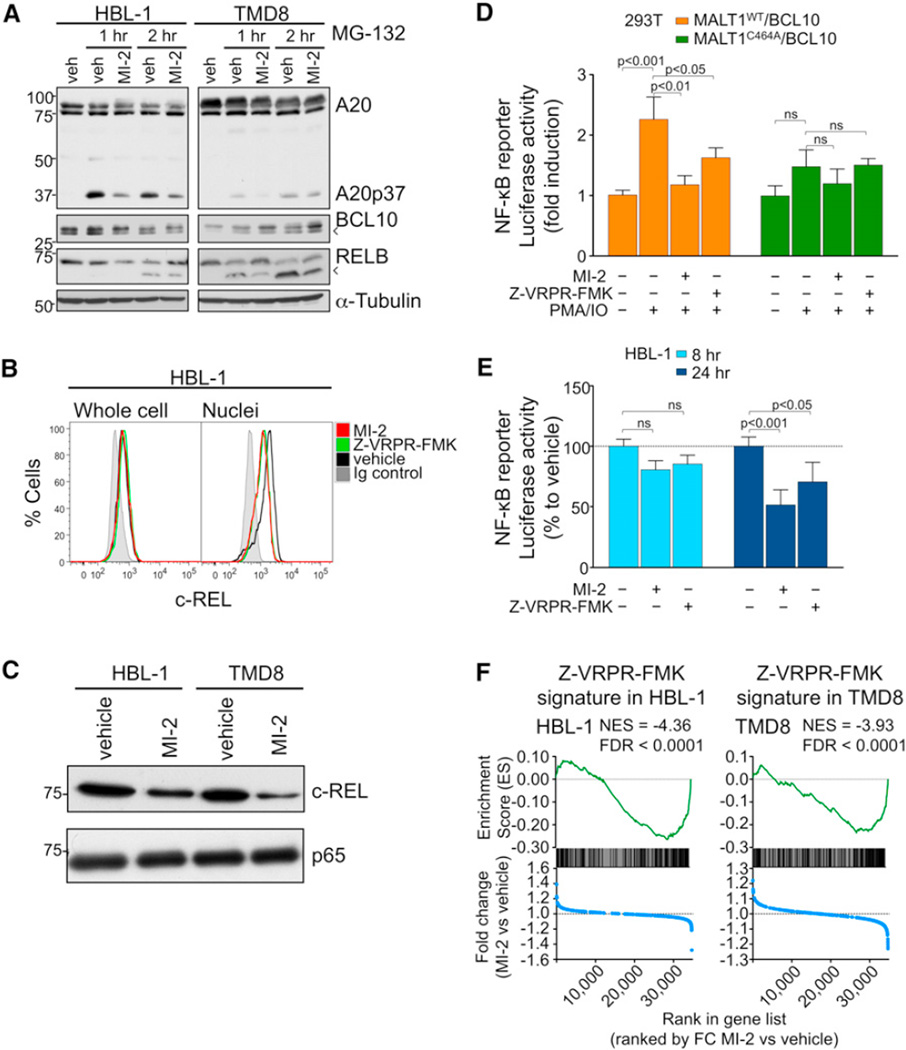
Figure 4. MI-2 Inhibits MALT1 Signaling in DLBCL Cells.
(A) Western blots for A20, RELB, and BCL10 after 30 min pretreatment with 2 µM MI-2 or vehicle, followed by proteasome inhibitor MG-132 (5 µM) treatment for 1 or 2 hr in HBL-1 and TMD8. Arrowheads indicate cleavage products.
(B) Flow cytometry for c-REL whole cells or isolated nuclei from HBL-1 cells treated with 200 nM MI-2, 50 µM Z-VRPR-FMK, or vehicle for 24 hr.
(C) c-REL and p65 protein expression in nuclear extracts of HBL-1 and TMD8 cells treated for 24 hr with 200 or 500 nM MI-2, respectively.
(D) NF-κB reporter assays in 293T cells transfected with the indicated expression constructs. Cells were treated for 30 min with 2 µM MI-2, 50 µM Z-VRPR-FMK, or vehicle followed by PMA/ionomycin for 2 hr. The y axis represents luciferase fold induction relative to vehicle-treated cells, normalized to internal control. Statistics, ANOVA, Bonferroni posttest.
(E) NF-κB reporter assays in HBL-1 cells treated with 200 nM MI-2, 50 µM Z-VRPR-FMK, or vehicle for 8 and 24 hr. The y axis represents % luciferase activity relative to vehicle-treated cells, normalized to internal control. Statistics, ANOVA, Bonferroni posttest.
(F) Enrichment of Z-VRPR-FMK-downregulated genes after MI-2 treatment in HBL-1 and TMD8 cells using GSEA. Normalized enrichment score (NES) and false discovery rate (FDR) values are indicated. Top: enrichment score versus relative position of ranked genes (green tracing); bottom: fold change (FC) MI-2/vehicle versus relative position of ranked genes (blue tracing). Experiments were performed in triplicate unless otherwise specified. Data are mean ± SEM.
See also Figure S4.

