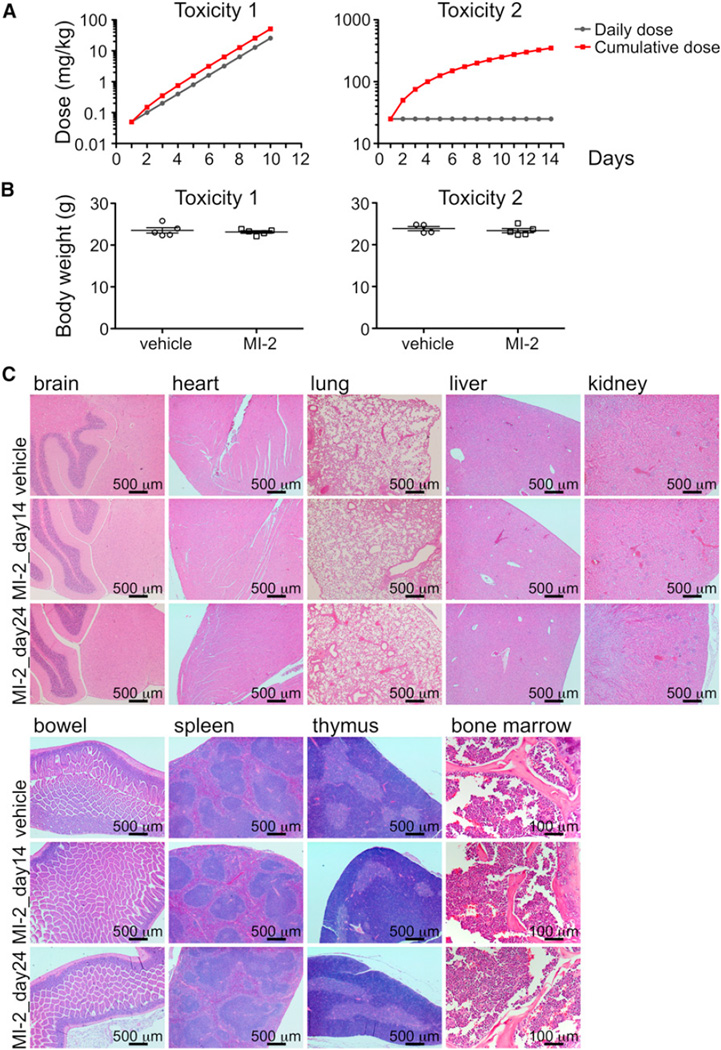
Figure 6. MI-2 Is Nontoxic to Animals.
(A) Dose scheme for toxicity 1 (increasing daily dose) and toxicity 2 (same daily dose) experiments show daily and cumulative doses for each experiment.
(B) The y axis depicts mean ± SEM body weight of animals studied in both the incremental and cumulative dose schemes. Toxicity 1, p = 0.59 t test; toxicity 2, p = 0.52 t test.
(C) H&E staining for the indicated tissues in animals treated with vehicle, MI-2 25 mg/kg daily for 14 days, or MI-2 25 mg/kg daily for 14 days followed by a 10 day washout.
See also Table S2.

