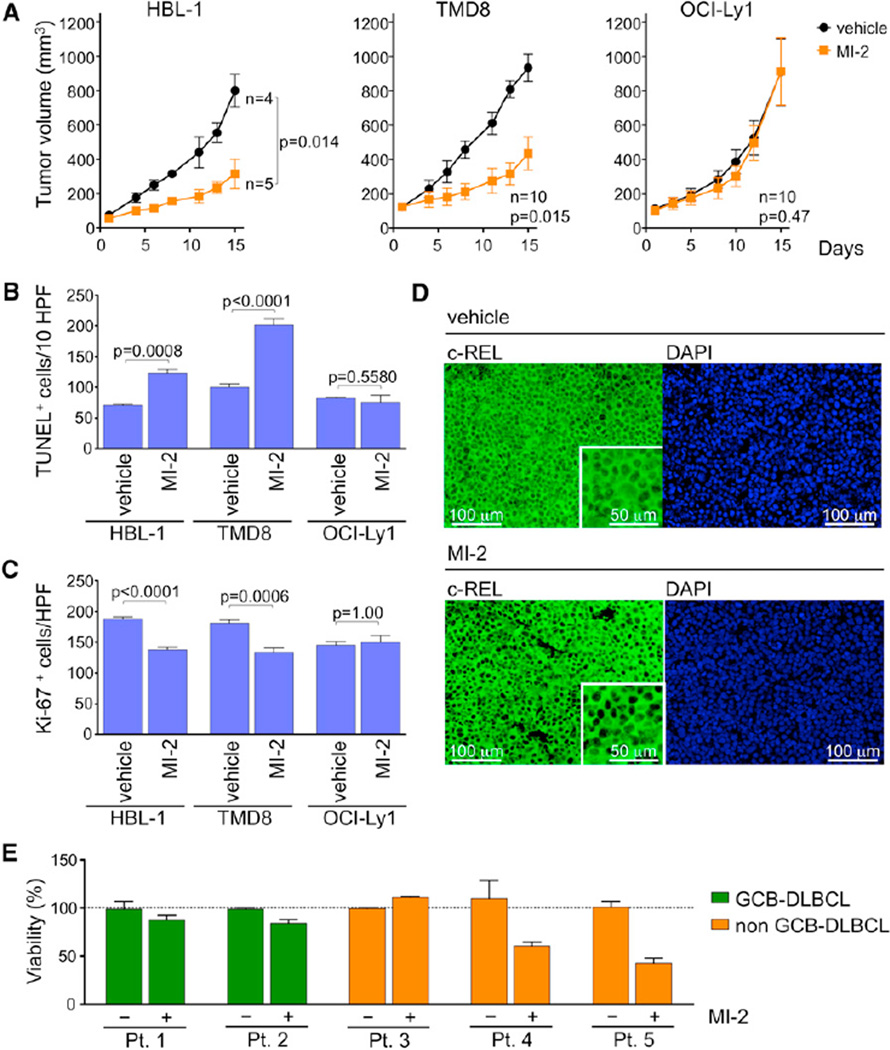
Figure 7. MI-2 Suppresses ABC-DLBCLs In Vivo and Primary Human DLBCL Ex Vivo.
(A) Tumor growth curve for HBL-1, TMD8, and OCI-Ly1 xenografts in NOD-SCID mice treated with 25 mg/kg/day MI-2 or the same volume of vehicle for 14 consecutive days. Statistics, paired t test.
(B) TUNEL+ staining in histologic sections of HBL-1, TMD8, and OCI-Ly1 xenografts. The y axis represents the number of TUNEL+ cells per ten high-power fields (HPFs; n = 5 tumors/treatment, n = 3 for HBL-1). Statistics, t test.
(C) Ki-67 immunohistochemistry staining of xenografted HBL-1, TMD8, and OCI-Ly1 tumor sections. The y axis represents Ki-67+ cells per high-power field (5 HPFs/tumor for n = 5 where analyzed for each treatment, n = 3 for HBL-1). Statistics, t test.
(D) Immunohistochemical detection of c-REL in sections from HBL-1 xenografts exposed to MI-2 or vehicle. Insets are 2× digital amplification. Representative image of three HPFs analyzed for n = 3 tumors stained for each treatment.
(E) Viability assays were performed in quadruplicate in primary human DLBCL patient samples treated for 48 hr with 0.8 µM MI-2 or vehicle. The y axis represents % of viable cells normalized to vehicle. Data are presented as mean ± SEM for all panels.
See also Figure S6.

