
Figure 2.
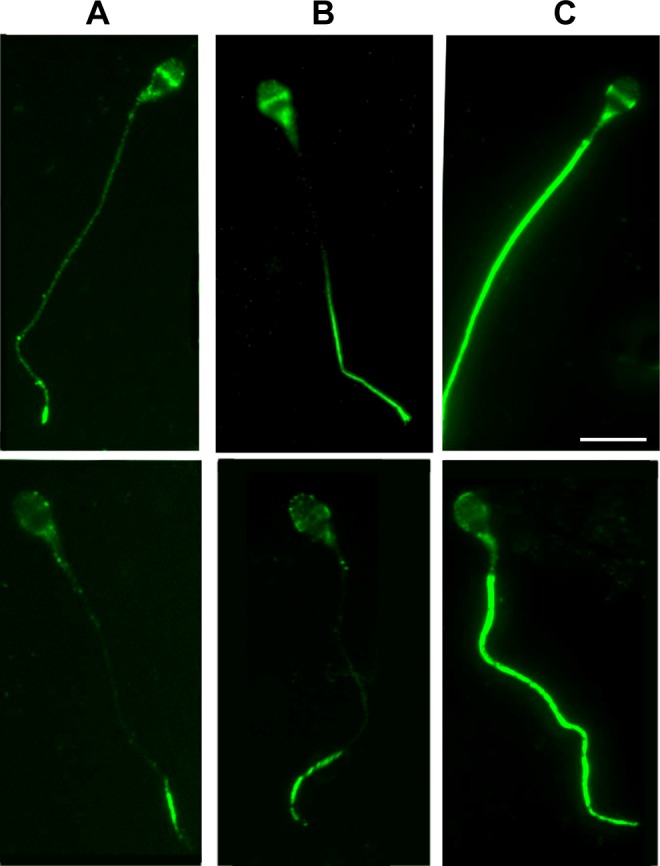
A representative figure for tyrosine phosphorylation (TP) at different time points. The extent of tyrosine phosphorylation is significantly increased at 1 hour (B) and 4 hours (C) versus at 0 time (A). Please observe major TP changes in the principal piece and the neck regions of mature sperm.