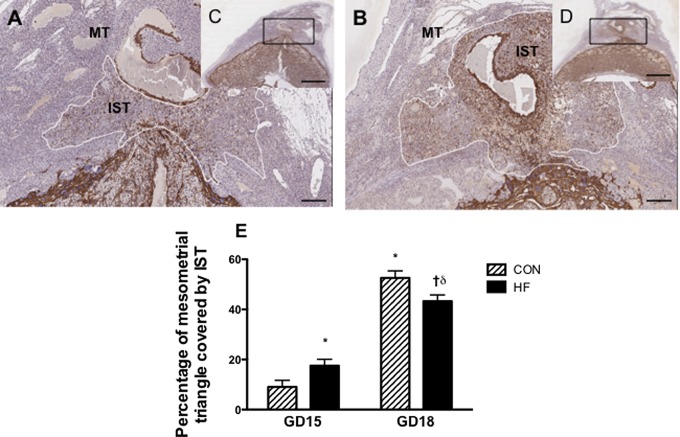
Figure 1.
Percentage of cross-sectional surface area covered by IST cells in the MT is increased at GD15 and reduced at GD18 in HF-fed dams. Central slides (5 μm thick) were stained with antipan cytokeratin. Cytokeratin staining (brown) indicates the presence of trophoblast cells. Representative images of GD15 uteroplacental unit from CON-fed (C) and HF-fed dams (D) are shown; scale bar = 600 µm. Panels A and B are magnified images of boxed region of panels C and D. respectively; scale bar = 150 µm. E, Graphical representation of the percentage of the mesometrial triangle invaded by IST cells at GD15 and GD18. P < .05 was calculated by 2-way ANOVA; * indicates significantly different from the GD15 CON-fed group; †, significantly different from the HF-fed GD15 group; δ, significantly different from the CON-fed GD18 group, 1 implantation site was examined per dam, with a minimum of 5 dams per group; IST, interstitial trophoblast; MT, mesometrial triangle; GD, gestational day; HF, high fed; CON, control; ANOVA, analysis of variance.

