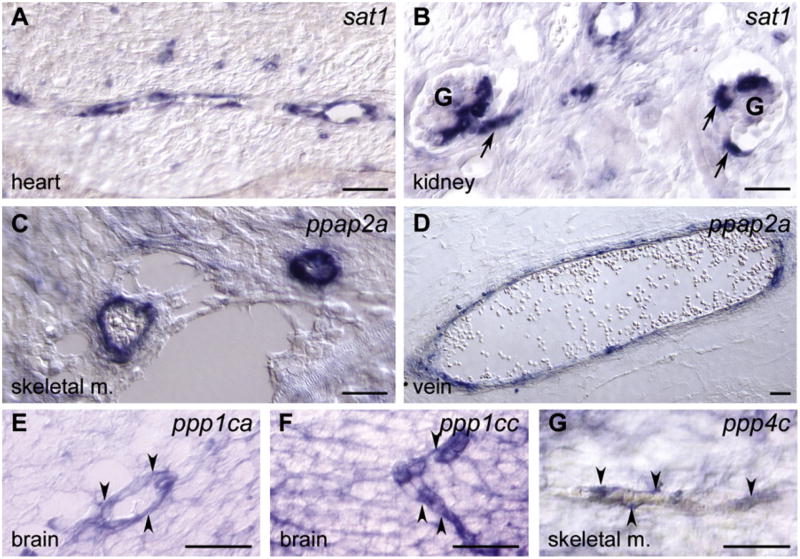
Figure 2. Validation of Vascular Expression of Gene Products Identified in the Reverse Genetic Screen.
(A–G) Gene expression determined by nonradioactive mRNA in situ hybridization (blue) on mouse tissues. (A) sat1 expression was restricted to the microvasculature in the heart at embryonic day (E) 17.5. (B) Expression of sat1 in the vasculature of kidney glomeruli (G) at E17.5. Arrows indicates afferent and efferent arterioles. (C and D) At E17.5, ppap2a was mainly expressed in large vessels, here exemplified by two vessels in skeletal muscle (skeletal m.) and a vein (vein). (E–G) The S/T protein phosphatases ppp1ca, ppp1cc, and ppp4c were all expressed in the vasculature as well as in other cell types. (E) Vascular ppp1ca staining in the brain at E17.5 (arrowheads). (F) Vascular expression of ppp1cc in the brain at E14.5 (arrowheads). (G) Vascular expression of ppp4c in skeletal muscle at E17.5 (arrowheads). Scale bars represent 100 μm.

