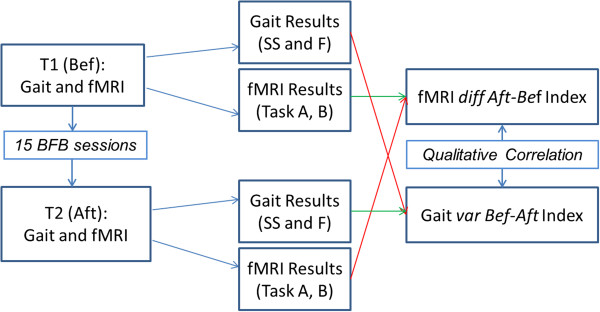
Figure 1.

Flowchart of the methodology. Flowchart of the study and of the methodology: fMRI and GAIT Analysis were performed on the subject before (T0 (Bef)) and after (T1 (Aft)) the rehabilitation treatment (BFB). From each session gait analysis and fMRI results were evaluated, difference between the results of the gait analysis before and after the BFB treatment (var Bef-Aft Index) were evaluated, finally a quantitative correlation analysis between the gait and fMRI categorical variables was performed.
