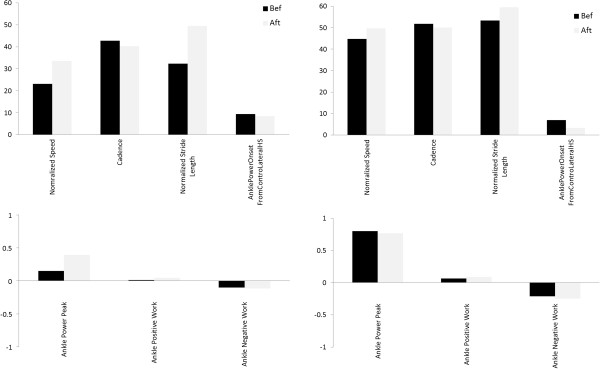
Figure 7.
Gait analysis results for the stroke patient. Gait analysis results for the Stroke Patient: on the left the contralateral side parameters evaluated at self-selected speed, on the right the contralateral side parameters evaluated at fast speed. In black the before rehabilitation treatment results (Bef), in grey the after rehabilitation treatment results (Aft).

