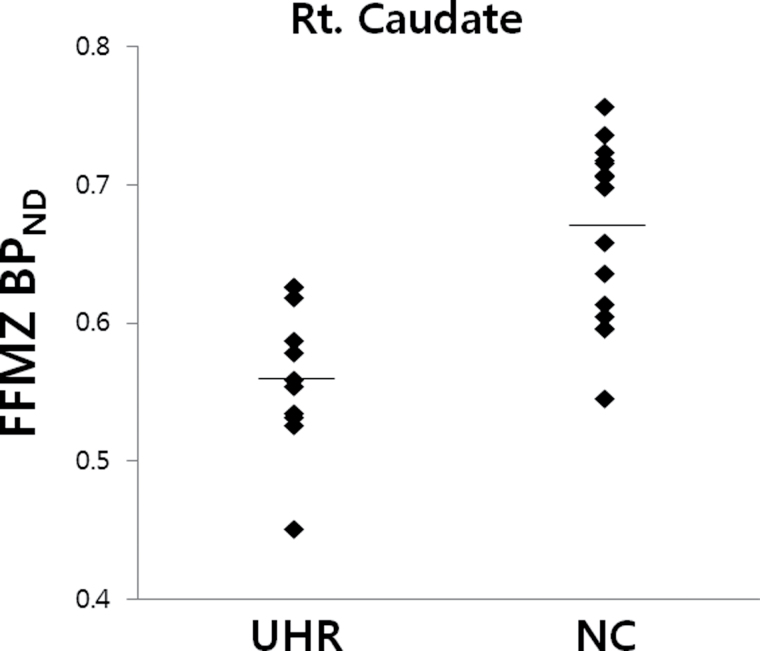
Fig. 3.
Scatter plots showing distribution of [18F]-FFMZ BPND values in the right caudate identified to have significant between-group difference from the whole-brain SPM analyses by group of individuals at ultra-high risk (UHR) for psychosis and normal controls (NC). The presented BPND values indicate those to be scaled by global BPND for individuals.

