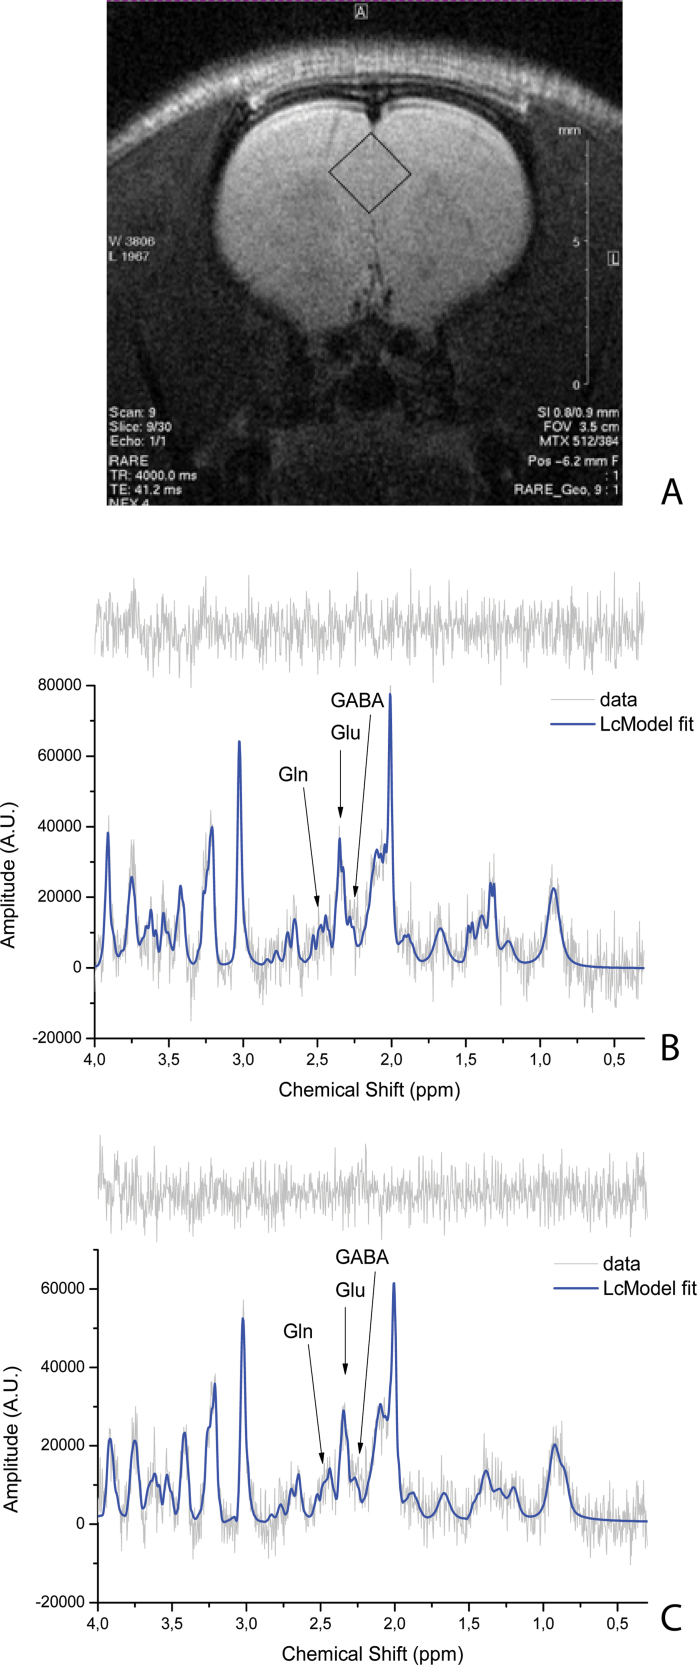
Fig. 1.
Voxel localization on rat anterior cingulate cortex (ACC) (A). Example of a correspondent baseline spectrum for isolated rat with time effect (TE) = 8ms, NSA = 128 (B). Example of a correspondent spectrum at time point KET9 with TE = 8ms, number of signal averages = 128 (C). On the top of each spectrum, the spectrum residue is shown.

