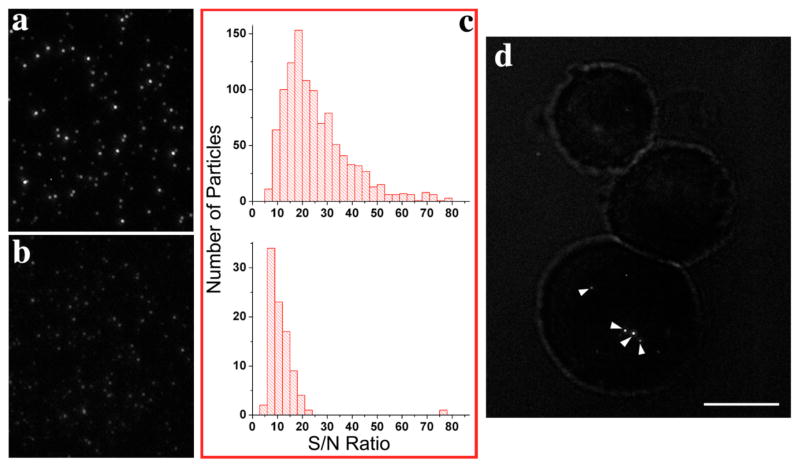
Figure 3.
Fluorescence microscope images show that at the single molecule level, QRs (a) are much brighter than QDs (b). (c) Statistical results of S/N distribution of QRs (top) and QDs (bottom) from 15 image sequences. The mean S/N for single rods is 26, while it is 11 for single dots. (d) Single QRs (indicated by arrows) are still very bright inside live MDA-MB-231 human breast cancer cells. Scale bar is 10 μm.

