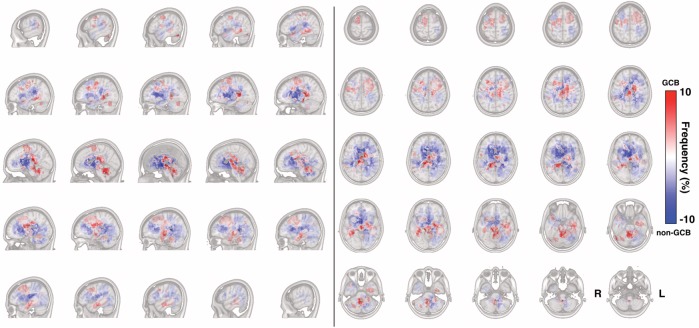
Fig. 6.
Different spatial distributions of GCB and non-GCB PCNSL. Frequency of GCB and non-GCB occurrence is calculated in a voxel-wise manner. A positive value (red voxel) suggests a location more likely to be affected by GCB PCNSL, while a negative value (blue voxel) suggests a location more likely to be affected by non-GCB PCNSL.

