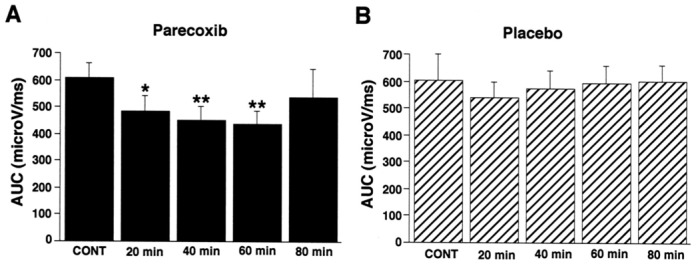
Figure 2.

Comparisons of the area under the recruitment curves (AUC) from the control baseline period (CONT), and 20, 40, 60 and 80 minutes after the administration of (A) parecoxib (black columns), or (B) placebo (hatched columns). A significant reduction in the recruitment curve was observed from 20 to 60 minutes after the administration of parecoxib but not with the placebo. Data are means ± SEMs. * = P<0.05, **= P<0.01.
