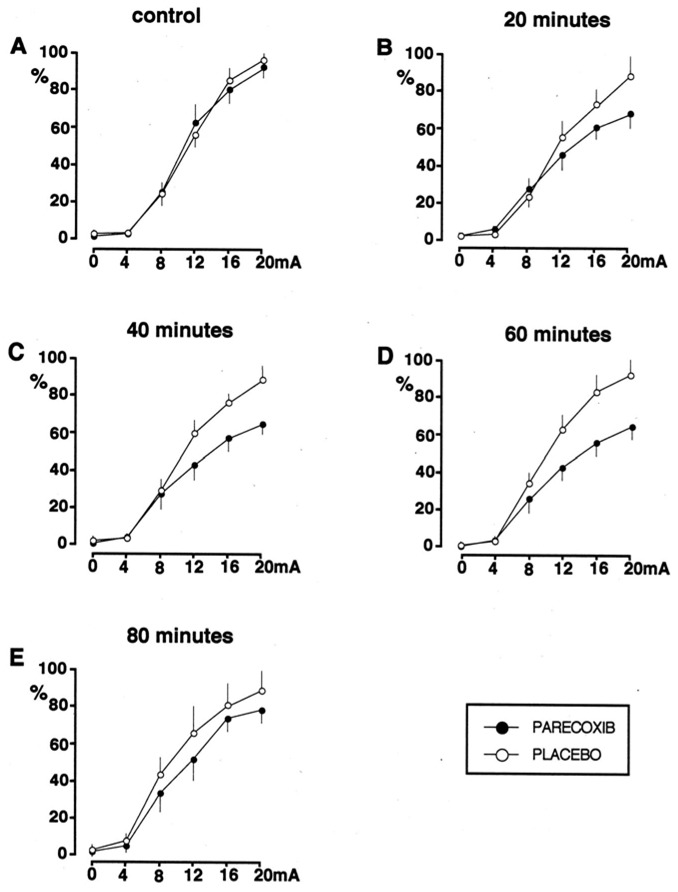
Figure 3.

Effects of administration of placebo or parecoxib on the shape of the recruitment curves for the RIII reflex at baseline (A), and 20 (B), 40 (C) 60 (D) and 80 (E) minutes after the administration of placebo or parecoxib. Reflex responses are expressed as a percentage of the maximum response obtained when building the control curve. A progressive reduction of the slope of the recruitment curve was observed from 20 minutes after the administration of parecoxib.
