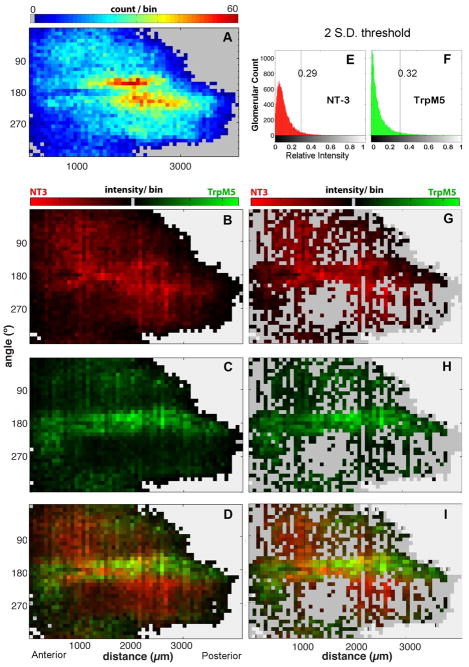
Figure 4.
Standard GLOMMap 2D plots comparing staining patterns for glomeruli positive for TrpM5 or NT-3 with a plot of overall glomerular density in the MOB. Each square in the plots represents the collection of glomeruli in a bin of 72 μm and 10°. The X-axis plots the distance in microns from rostral tip of bulb (AP axis); the Y-axis gives the cylindrical coordinates around the perimeter of each bulb cross-section, where 0°, 90°, 180°, and 270° respectively indicate dorsal, lateral, ventral, and medial aspects. (A) A plot of the density of all glomeruli across location in the MOB (n = 8 bulbs). Warmer colors indicate more glomeruli per bin. Gray indicates outside of MOB. Two regions of increased glomerular density (red-yellow regions) occur on the ventrolateral and ventromedial surfaces of the mid-caudal bulb, between 160 and ~200° and between 1500 and 3000 μm AP. (B–D) 2D plots of the identical glomerular bins from A, but with color indicating average normalized staining intensity in each bin (instead of count) for the two markers: brighter greens indicate stronger TrpM5 staining intensity, while brighter reds indicate stronger NT-3 staining intensity. Black indicates a background subtracted binned intensity value of zero. B. 2D intensity plot for NT-3 positive glomeruli. C. 2D intensity plot for TrpM5 positive glomeruli. D. True color overlay of the green and red intensity plots shown individually in panels B and C so that a yellow hue indicates an equivalence in intensity values. The region of maximal co-localization lies along the ventral margin of the bulb (180°), but anterior (1000 – 1500 μm AP) to the region of highest overall glomerular density (yellow-red regions of panel A) (E & F) Normalized brightness histograms for all glomeruli for each channel after applying a 2 S.D. threshold cut-off. E: For NT-3, the normalized cut-off relative value is 0.29. F: For TrpM5, the normalized cut-off value is 0.32. G–I: GLOMMap 2D plots of normalized intensity of glomeruli above threshold similar to those of panels B–D, but showing only the brightest glomeruli (i.e. strongly positive for either marker) in which only those glomeruli with an intensity greater than two 2 S.D. above the mean in either color channel are plotted (leaving 9.3% of all glomeruli). Regions with no glomeruli above that cutoff are indicated by the darker gray. Few regions contain glomeruli that are heavily labeled by the two markers as indicated by yellow-orange hues.

