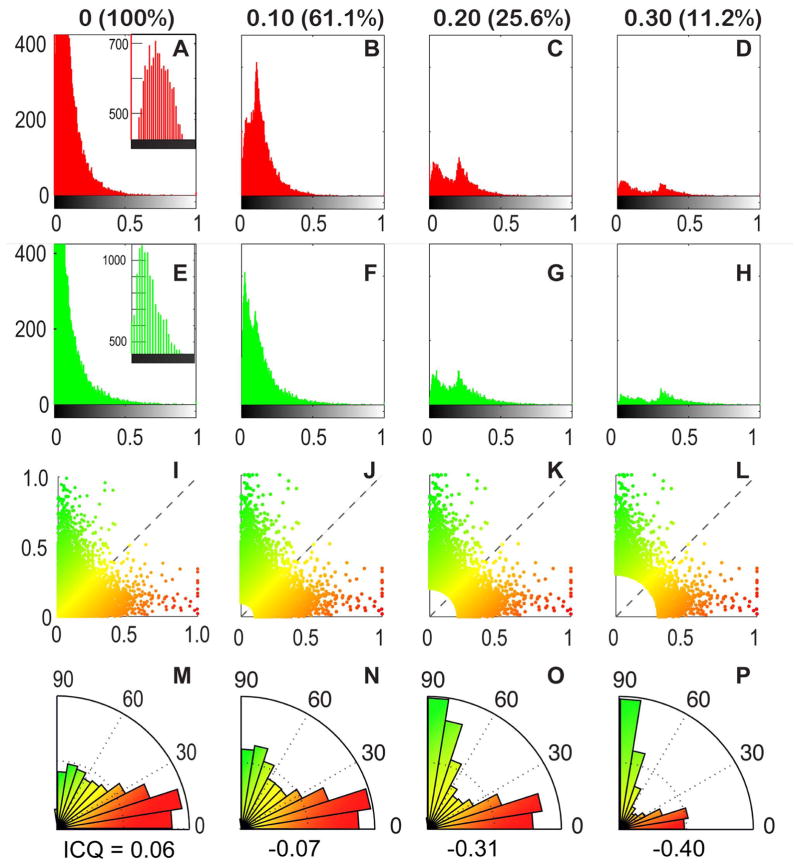
FIGURE 6.
Glomeruli positive for NT3 and TRPM5 show increasing anti-correlation at higher intensity. Each column in the figure (e.g. A–M, B–N, etc.) depicts glomeruli that exceed the intensity threshold criterion in 2 channel intensity space; the column headers indicate the intensity threshold (ranked from 0 to 1) and the percent of data remaining. In the first column (A–M), no threshold was applied and 100% of the data are represented. In the subsequent columns, incrementally higher intensity thresholds were used (B–N = 0.1; C–O = 0.2; D–P = 0.3) to reduce the dataset to smaller percentages representing brighter values. For each incremental subset, we increasingly eliminate glomeruli in which the normalized intensity of label fall below the indicated threshold in the 2 channels. For example, in the 0.1 column (B–N), all glomeruli with normalized intensities below 0.1 in the red and green channels are eliminated (61.1% of glomeruli remain). Correspondingly, in the 0.3 column, glomeruli with intensities below 0.3 in the 2 channels are eliminated (11.2% of glomeruli remain). Row 1 (A–D) Intensity histograms for the red channel across all datasets. In A, the inset shows the peak of the histogram. A large population of glomeruli with zero intensity can be seen here but are truncated in the full histogram. In B–D, the histograms have two peaks, indicating two populations of glomeruli: a more strongly labeled population and a weaker labeled one. The weakly labeled glomeruli are those that are above threshold due to brightness in the green channel although relatively dim in red. This bimodal distribution more clearly resolves into two distinct populations in C and D. Row 2 (E–H). Intensity histograms from the green channel displayed as in Row 1 and show a similar bimodal distribution. E. Inset shows peak of histogram truncated in the main panel. Row 3 (I–L) Color scatter plots in 2 color intensity space: red channel intensity (x-axis) plotted against green channel intensity (y-axis). Each dot represents one glomerulus. Glomeruli eliminated by the threshold cut-off occupy the lower left hand corner of plot as indicated by the increasingly larger white region in that corner (J–L). The statistical elimination of most glomeruli with even a low threshold indicates that most glomeruli are weakly or poorly stained by both TRPM5 and NT3. Furthermore, those glomeruli that are strongly labeled by one label tend to be weakly labeled by the other. Row 4 (M–P) Color-coded angle histograms showing the relative staining of suprathreshold glomeruli in red and green channels. For ease of comparison, the histograms are normalized to maximum bin count. In these histograms, a glomerulus with a normalized intensity of 1.0 in the red channel, and a normalized green intensity of 0 would fall in the 0–10° bin. By comparison, a glomerulus with green intensity of 1.0 and a red intensity of 0 would fall in the 80–90° bin. The low number of glomeruli near the 45 degree angle demonstrates the paucity of double label. The intensity correlation quotient (ICQ, Li et al., 2004) is listed below each histogram is listed the intensity correlation quotient. ICQ values range from −0.5 to 0.5; an ICQ value close to zero indicates a random (or mixed) staining pattern. Positive ICQ values indicated dependent staining patterns and negative ICQ values indicate a segregated staining pattern. These results further confirm that glomeruli strongly labeled by one marker tend to be weakly labeled by the other; few glomeruli are strongly labeled by both markers.

