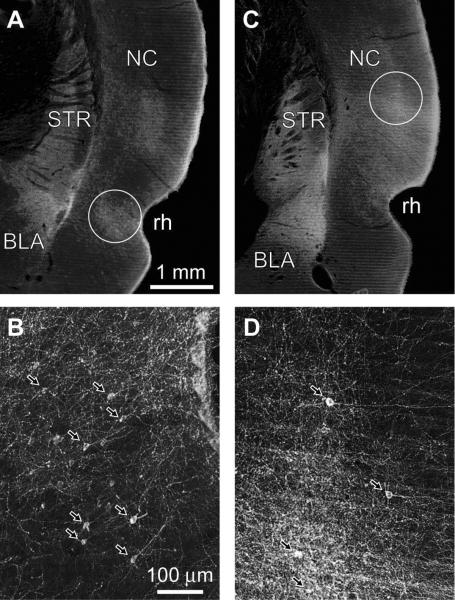
Fig. 1.
Dark-field photomicrographs depicting iontophoretic PHAL injections in the PRC (A–B) and NC (C–D) at low (A,C) and high (B,D) magnifications. (B, D) Portions of the circled areas in A and C are depicted at a higher power in B and D, respectively. Arrows point to PHAL-labeled somata. Scale bars in A and B apply to C and D, respectively. BLA, basolateral amygdala; STR, striatum; NC, neocortex; rh, rhinal sulcus.

