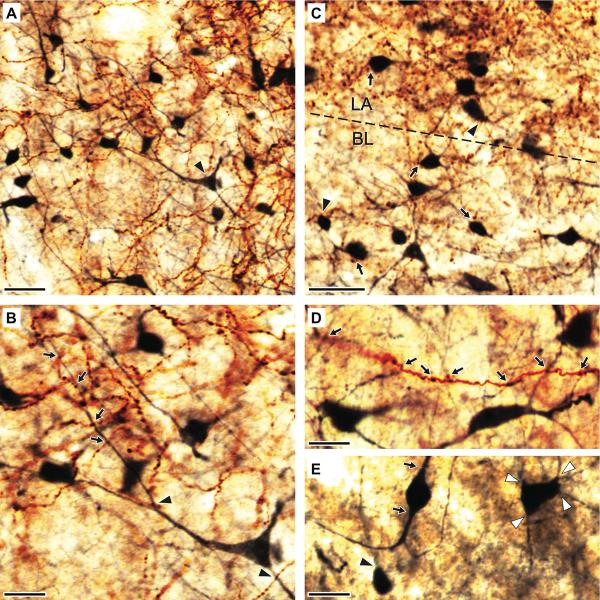
Fig. 3.
Spatial relationship between anterogradely labeled cortical axons and CB+ interneurons of the BLA. (A–E) Photomicrographs depicting PHAL+ axons (brown reaction product of DAB) and CB-immunoreactive profiles (dark blue reaction product of Ni-DAB) in the BLA. Low- (A) and high-power (B) images depicting neocortical axons and axonal varicosities and CB+ somata and dendrites in the ventral portion of LA. The pyramid-shaped multipolar cell marked by an arrowhead in A is enlarged in B to show its aspiny dendrites. PHAL+ axonal varicosities are seen in close apposition with the proximal (arrowhead) and distal (arrows) dendrites of this neuron. (C) A photomicrograph from the LA-BL border (dashed line) depicting spatial relationship between PHAL+ axonal varicosities and CB+ somata. Typically, a clear gap was seen between PHAL+ boutons and CB+ somata (arrows). Close appositions (arrowheads) were seen far less frequently. (D) Single PHAL+ cortical axon contributing axonal varicosities seen in close apposition with the dendrites of different CB+ cells (arrows). (E) Variations in the shape of CB+ somata. The most common group of cells consisted of multipolar neurons, with four of more dendrites emerging from their somata (white arrowheads). A minority of cells had small, round somata from which emerged a single dendrite (black arrowhead). Also infrequent were neurons with fusiform or ovoid perikarya from which emerged to main dendritic branches (arrows). Scale bars: 40 μm in A; 20 μm in B–E.

