
Figure 1.
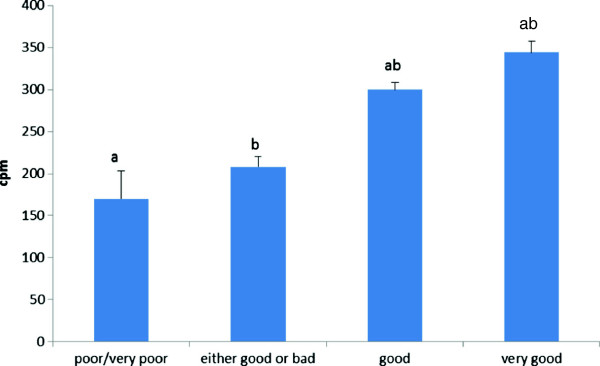
Mean (SEM) overall PA levels in counts per minute (cpm) in the different self-reported health groups (“poor/very poor health”, “either good or bad health”, “good health”, and “very good health”).a-b: Equal letter indicate significant difference (p<0.05) in overall PA level between the different self-reported health groups. All values are adjusted for age, BMI, education level, and test centre.