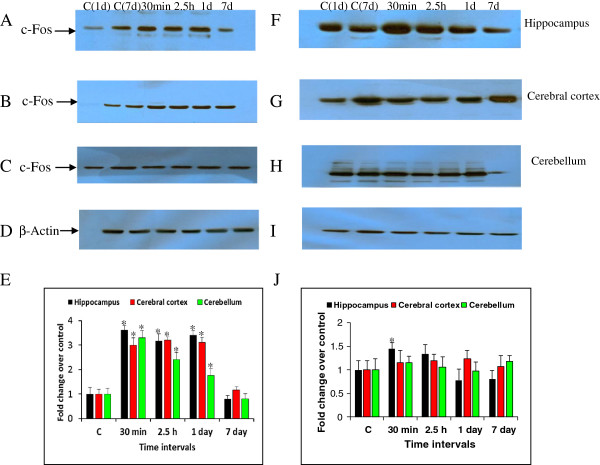
Figure 5.
c-Fos protein levels after soman and antidotes treatment. Efficacy of HI-6 (50 mg/kg, i.m), atropine (10 mg/kg, i.m) and midazolam (5 mg/kg, i.m) on soman induced c-Fos protein levels of rats sacrificed at 30 min, 2.5 h, 1d and 7d time points (n = 4 per each time point). c-Fos immunoreactivity levels in the rat hippocampus (A), cerebral cortex (B) and cerebellum (C) after soman exposure (E-bar graph). c-Fos immunoreactivity levels in the rat hippocampus (F), cerebral cortex (G) and cerebellum (H) after antidotes treatment (J- bar graph). β-actin (D and I) was used as protein loading control. Letters on blot C1 (1d) and C2 (7d) indicate the control samples collected after 1 and 7 days after HI-6 (50 mg/kg, i.m), saline (100–120 μl/rat, s.c), atropine sulphate (10 mg/kg, i.m), and midazolam (5 mg/kg, i.m), treatment. Densitometric quantification of band intensities are presented as fold change over control (presented as 1.0). A difference of p < 0.05 was considered significant (*).

