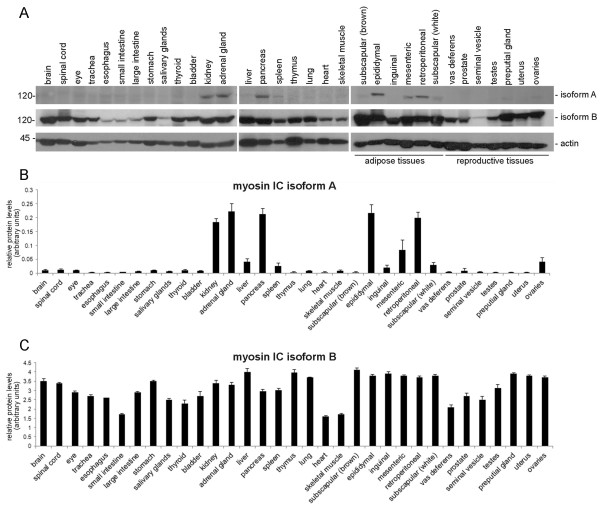
Figure 2.
Protein expression of myosin IC isoforms A and B in mouse tissues. Detection of myosin IC isoforms A and B in various mouse tissues by immunoblot analysis using antibodies specific to myosin IC isoforms A, isoform B, and actin (control). A) Representative immunoblots of mouse tissue extracts that were analyzed using the indicated antibodies. Relevant molecular weight markers are indicated on the left. B) Histogram presenting the average densitometric intensity of isoform A expression normalized to actin. C) Histogram presenting the average densitometric intensity of isoform B expression normalized to actin. Results are presented as means + standard deviation; n = 3-6 (depending on tissue type).

