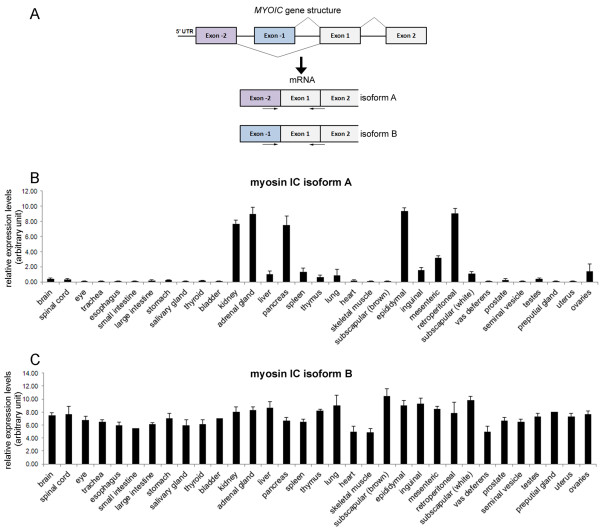
Figure 3.
mRNA expression of myosin IC isoforms A and B in mouse tissues. A) Schematic depicting the 5’ region of the MYOIC gene and the resulting mRNA structure. The target sequence region and location of primer used for qRT-PCR to detect myosin IC isoforms A and B are indicated by arrows. B) Quantitative real-time PCR analysis of mRNAs expression levels of myosin IC isoform A normalized to GAPDH. C) Quantitative real-time PCR analysis of mRNAs expression levels of myosin IC isoform B normalized to GAPDH. Results are presented as means + standard deviation; n =3-6 (depending on tissue type).

