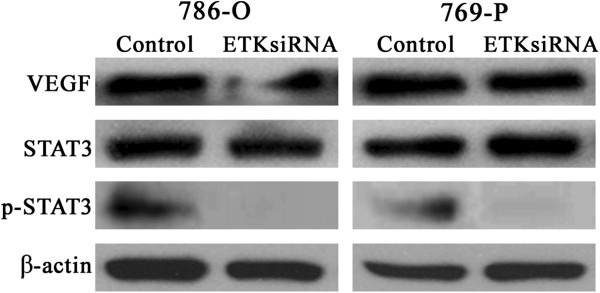
Figure 6.
Expression of VEGF and STAT3 after ETK knockdown. Western blot showed that the expression of VEGF and p-STAT3 were decreased, especially the expression of p-STAT3 (P<0.01). While the unactivated STAT3 protein remained invariable (P>0.05). Protein concentrations were 8 μg/ml. β-actin is the loading control.

