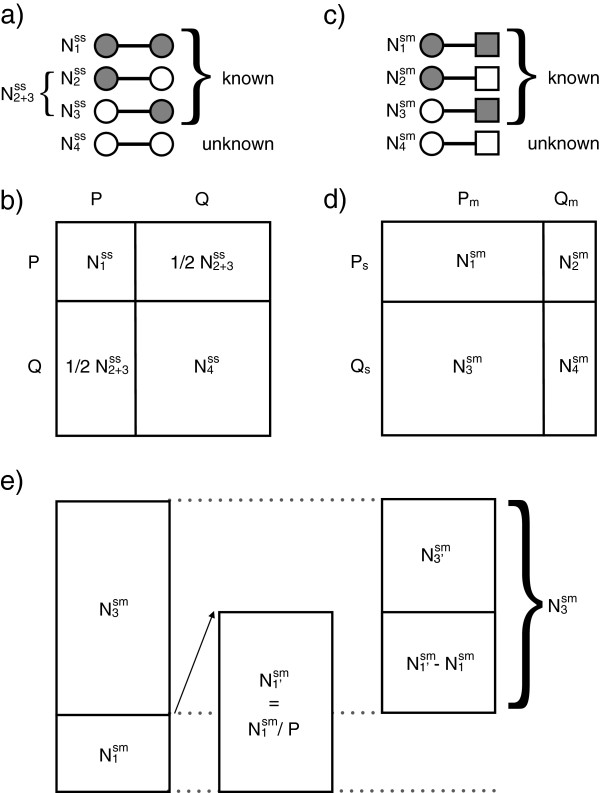
Figure 1.
Models of contact reporting probabilities. (a) Contact reporting probabilities based on pairs of survey reports (ss), where a circle stands for a contact reported (grey) or not reported (white) by a survey participant. There are four possible combinations: (i) where both contact partners report the contact, (ii) and (iii) where only one of the contact partners report the contact (since and are indistinguishable, we use their sum ), and (iv) where none of the two contact partners report the contact. (b) All possible combinations of survey reporting statuses, where P stands for the probability of reporting a contact and Q is the complement. (c) Survey reports and mote detections of contacts combined (sm), where a rectangle stands for a contact detected (grey) or not detected (white) by a pair of motes. There are four possible combinations: (i) where a contact pair is reported in the survey and recorded by motes, (ii) and (iii) where only the survey or motes recorded the contact, and (iv) where a contact that actually took place was neither reported nor detected by a mote. (d)Ps and Pm stand for average survey and mote reporting probabilities, and Qs and Qm are the average probability of a survey or mote not recording a contact respectively. (e) The estimated proportion of the difference between survey and mote data that can be attributed to survey underreporting, based on the models (b) and (d). Here, is the estimated amount of contacts detected by the motes and also reported by the study participants if there was no underreporting (estimate is based on P), is the estimated amount of mote-detected but not survey-reported contacts due to underreporting, and , is the estimated amount of non-reporting due to differences in contact definitions between the survey and mote studies.

