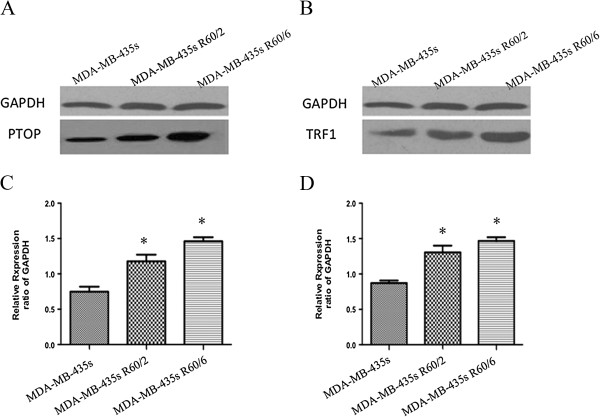
Figure 3.

Changes of PTOP and TRF1 proteins in different groups. (A and B) Western blot showed the protein of PTOP and TRF1 in irradiated groups were significant over expressed than the non-irradiated group (MDA-MB-435 s). (3C and 3D) The bar chart demonstrated the semiquantitative analysis of PTOP and TRF1 expression. Data represented means ± SD,*p < 0.05 was considered significant.
