
Figure 8.
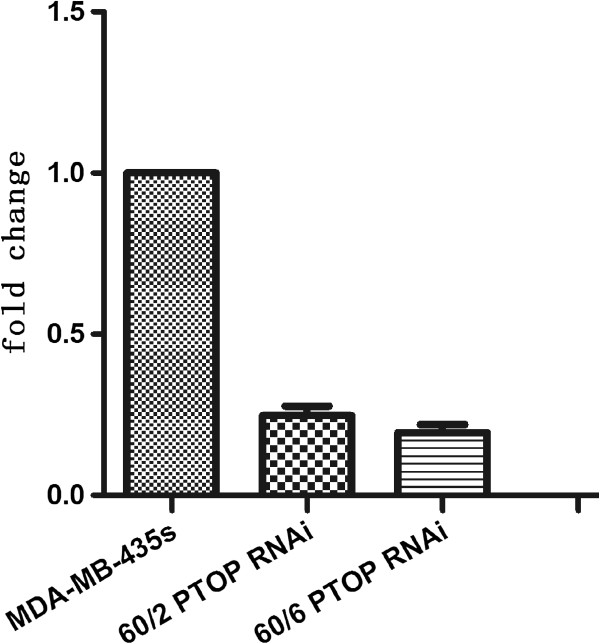
mRNA expression of Knocking down PTOP in different groups. The results showed the relative levels of silenced PTOP mRNA compare with GAPDH in 3 cell groups. Bar graph showed the mean ± SD value of relative mRNA expression, *p < 0.05 was considered significant.