Figure 4.
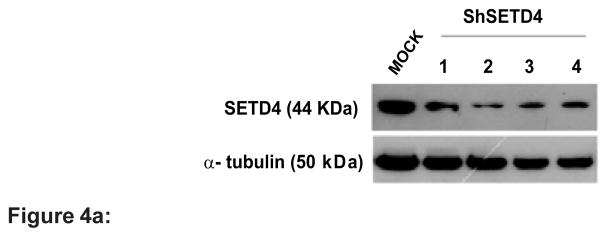
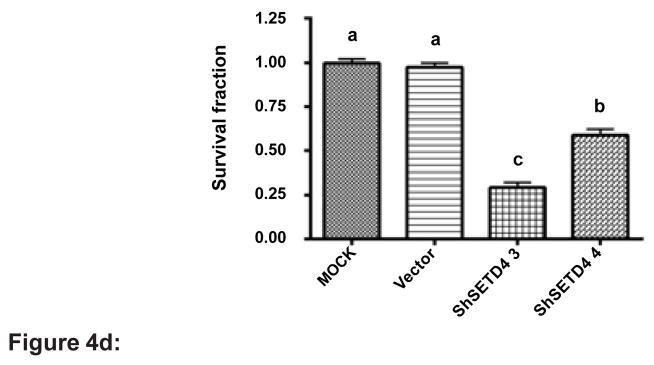
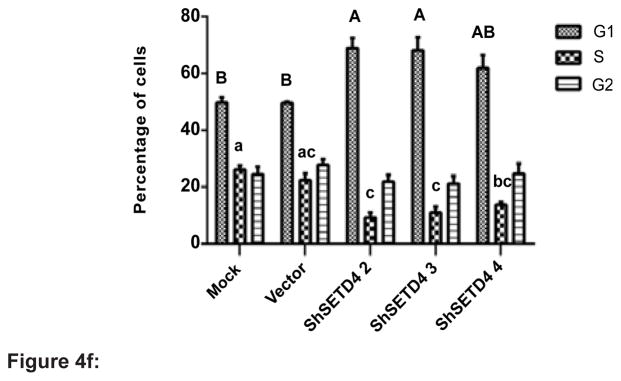
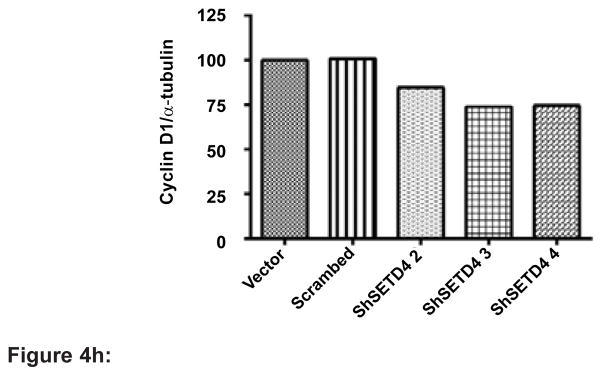
Figure 4a: Knockdown of SETD4 leads to the significant growth suppression of cancer cells. Lysates from the MDA-MB 231 stable knockdown cells (ShSETD4 1–4) were immunoblotted with antibodies against SETD4 and α-tubulin (as an internal control) to evaluate SETD4 knockdown.
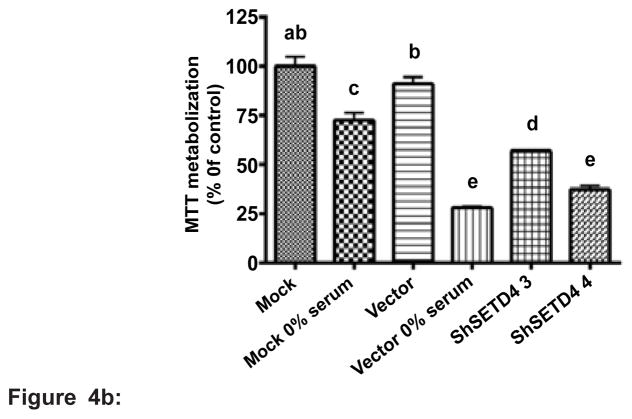
Figure 4b: Effects of SETD4 knockdown on the viability of MDA-MB 231 cells, as measured by the MTT assay. Mock (non-transfected MDA-MB 231 cells), vector (cells transfected with empty vector) and two independent clones (shSETD4 3 and 4) were plated in medium containing FBS for 72 h. Mock and vector cells were also maintained in medium without FBS (0% serum). The results are expressed relative to mock cells. Means followed by the same letter indicate no significant difference by Tukey’s test (p<0.001). The results are representative of three independent experiments.
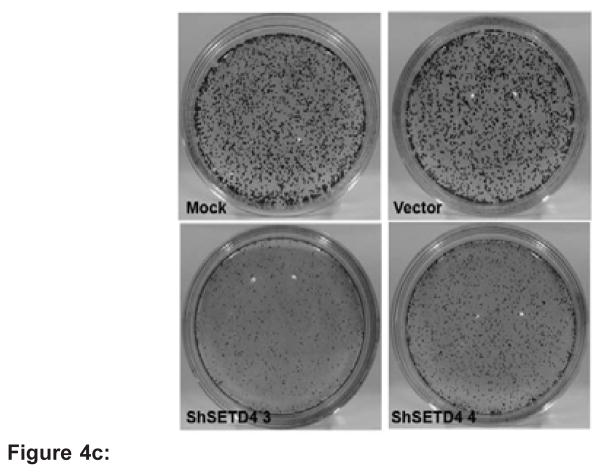
Figure 4c: Colony formation assay of shSETD4 cells. Cells were grown until colonies formed (10 days) and then stained, fixed and counted.
Figure 4d: The mean survival fraction ± SEM of triplicate wells was normalized to mock cells based on the plating efficiency. Tukey’s test (p<0.001).
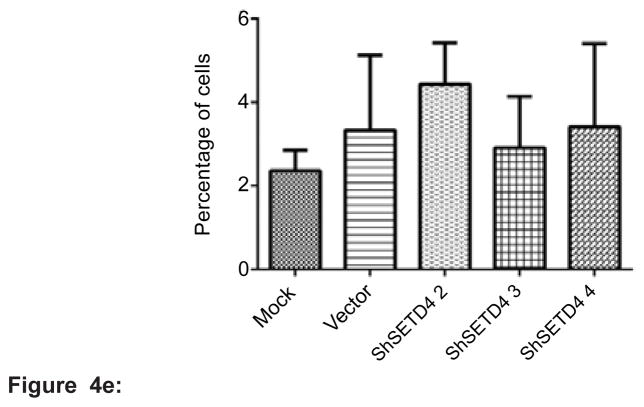
Figure 4e: Flow cytometric analysis of sub-G1 DNA content revealed no significant differences between groups of cells by Tukey’s test (p<0.001).
Figure 4f: Cell cycle distribution was analyzed by flow cytometry after staining with propidium iodide. Data from the numerical analysis in which cells were classified by cell cycle status are expressed as percentages. Means followed by the same letter indicate no significant difference by Tukey’s test (p<0.05). Uppercase and lowercase letters represent the analysis of G1 and S phase, respectively. The results are expressed as the percentage of events from a total of 20000 events (n=3).
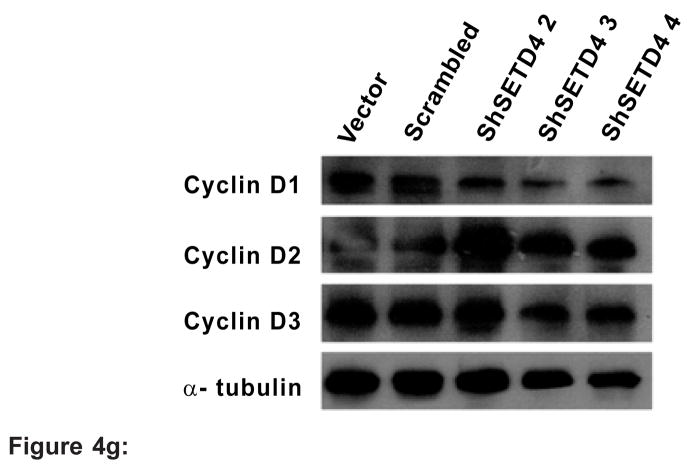
Figure 4g: Immunoblots were performed to quantify the expression of cyclin D1, D2 and D3. α-Tubulin was used as an internal control.
Figure 4h: Densitometric analysis confirmed reduced cyclin D1 expression to approximately 30%.

