
Figure 3.
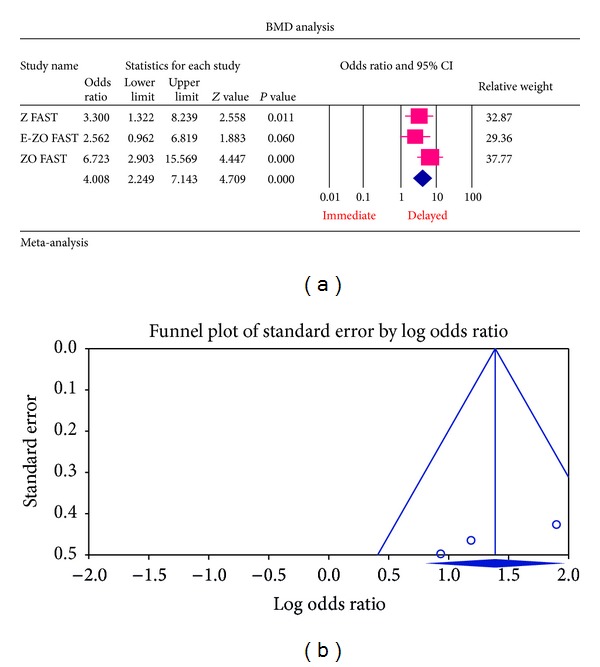
(a) Forest plot from the meta-analysis of LS BMD T score analysis of patients at 12 months, who had osteopenic BMD at baseline, between immediate and delayed zoledronic acid groups. (b) Funnel plot from the meta-analysis of LS BMD T score analysis of patients at 12 months, who had osteopenic BMD at baseline, between immediate and delayed zoledronic acid groups.