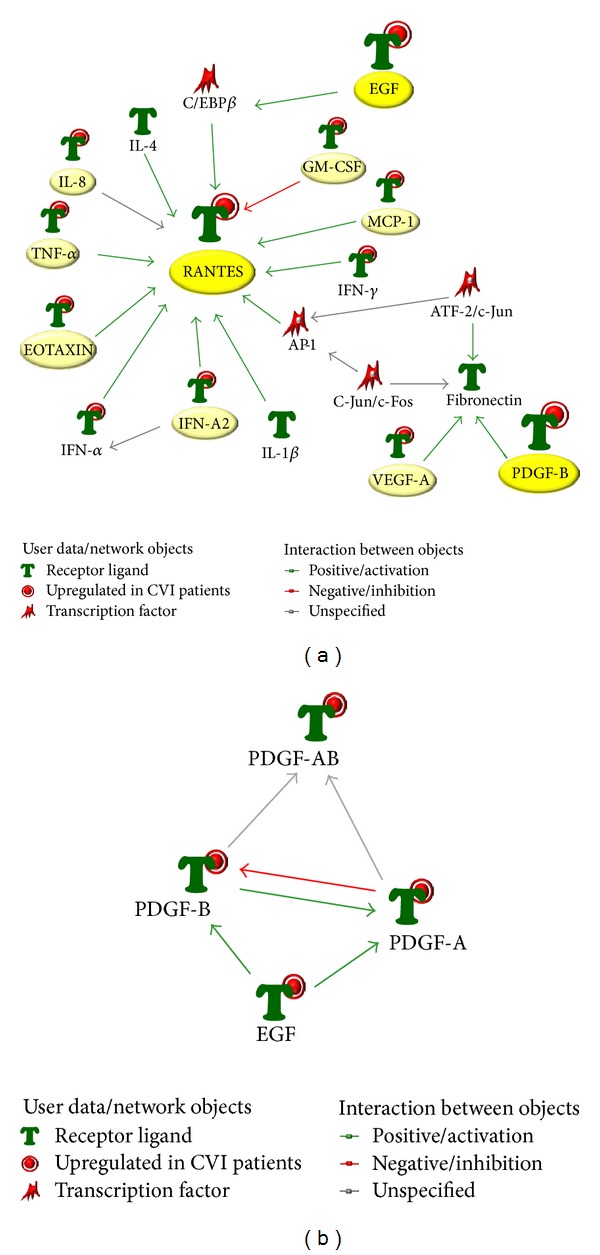
Figure 4.

Network analysis of the cytokines/chemokines differentially expressed in the context of CVI. The identified panel of cytokines/chemokines characterizing CVI was assessed for network analysis. In (a), the top-score biological network generated by using the analysis network algorithm illustrating the connections among the differentially expressed cytokine/chemokine highlighting the role of RANTES as hub. In (b), proteins network between PDGF and EGF generated by the shortest path algorithm is shown.
