
Figure 3.
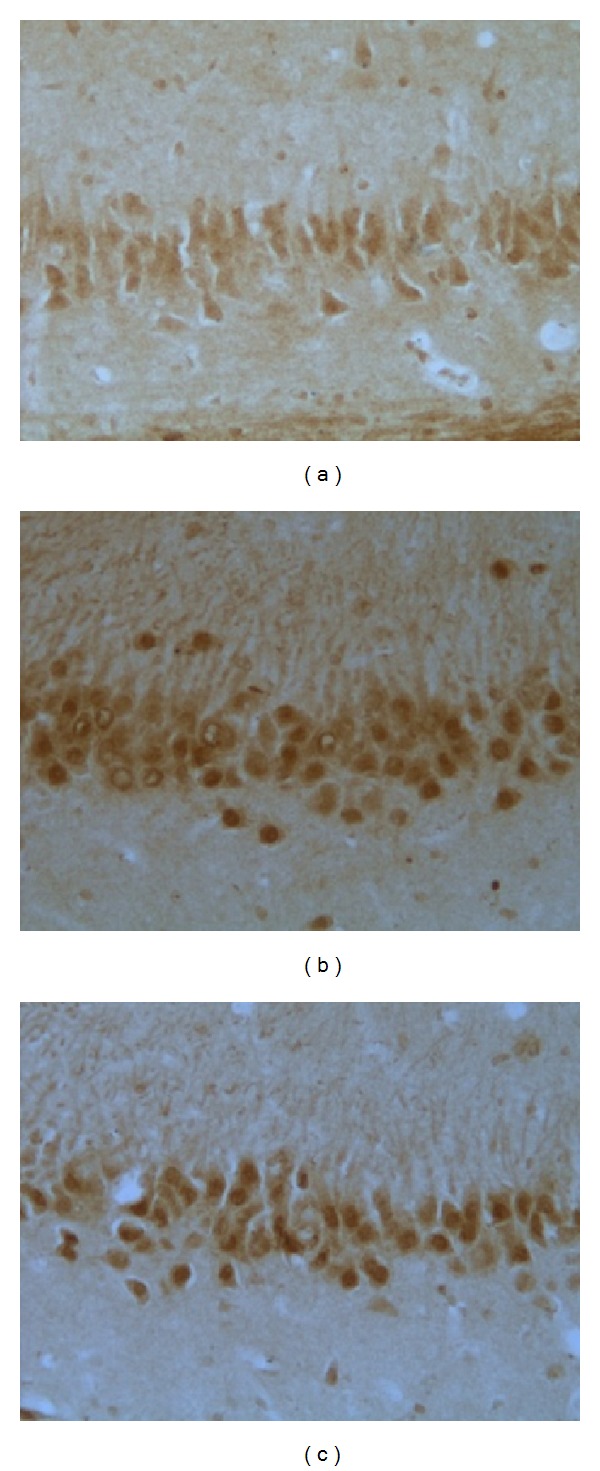
Representative immunohistochemistry results showing IL-1beta levels and neuron morphology in the hippocampus CA3 region in the following groups (n = 10 per group): (a) control, (b) model, and (c) EA.
Official websites use .gov
A
.gov website belongs to an official
government organization in the United States.
Secure .gov websites use HTTPS
A lock (
) or https:// means you've safely
connected to the .gov website. Share sensitive
information only on official, secure websites.
Representative immunohistochemistry results showing IL-1beta levels and neuron morphology in the hippocampus CA3 region in the following groups (n = 10 per group): (a) control, (b) model, and (c) EA.