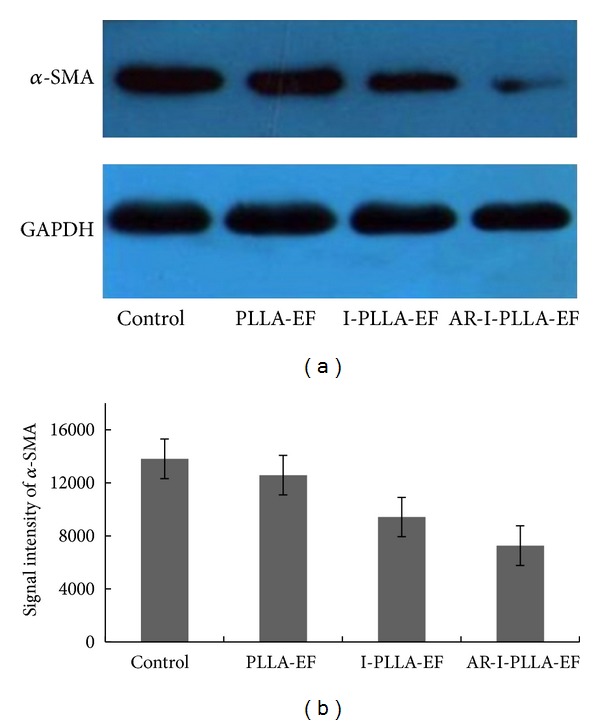
Figure 7.

Western blot analysis of α-SMA on the 14th day after operation. (a) The levels of α-SMA in scars of different groups by Western blot. (b) Analysis of the signal intensity of α-SMA was performed among four groups. *P < 0.05 compared to control group; **P < 0.01 compared to control group.
