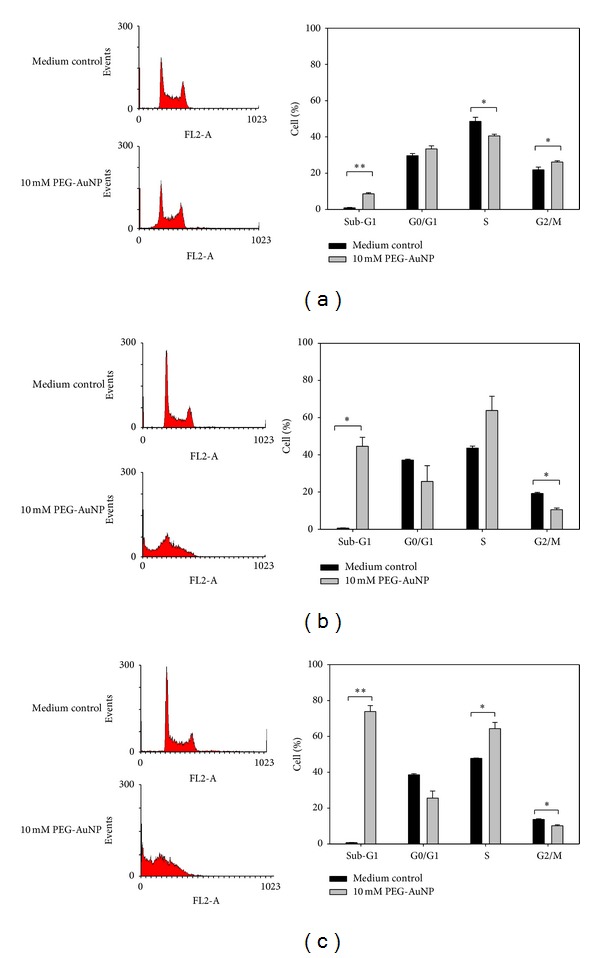
Figure 5.

Cell cycle distribution of K562 cells treated with medium only, PEG-AuNPs 10 mM, for (a) 24 h, (b) 48 h, and (c) 72 h (compared with the control medium: *P < 0.05 and **P < 0.01). Cell cycle distribution was analyzed by flow cytometry and the percentages of cells in different cycle phases were automatically determined using ModFit cell cycle analysis software. Data are representative of three independent experiments.
