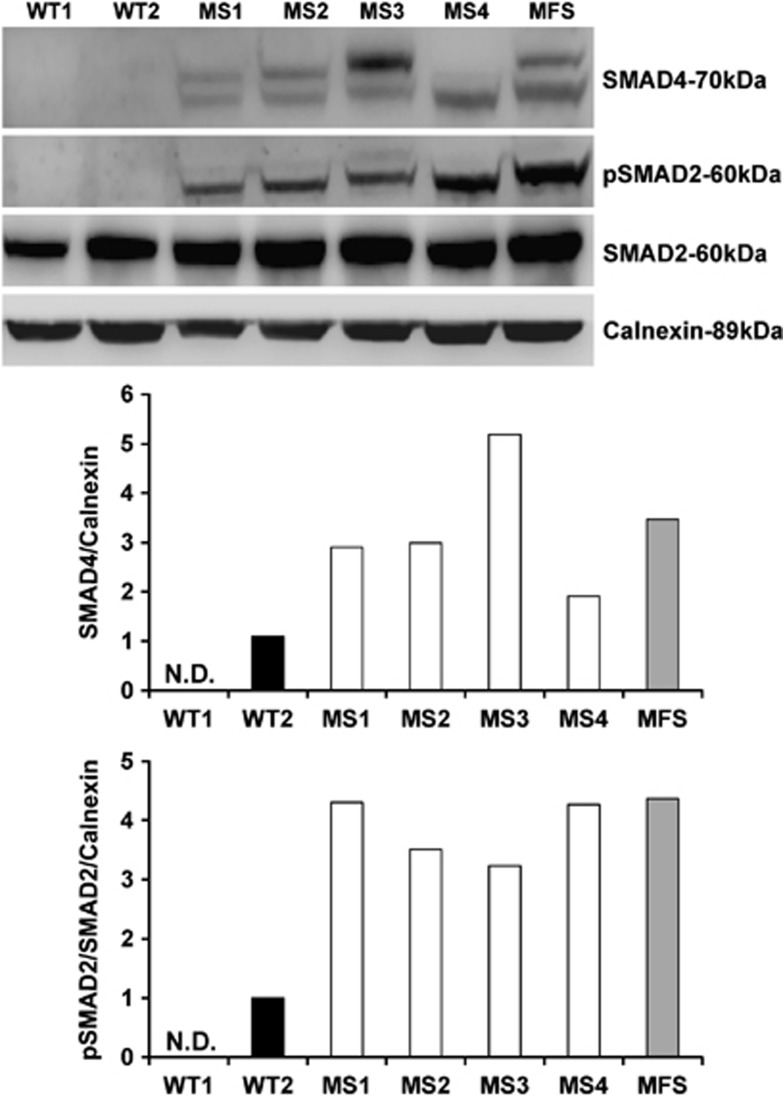
Figure 1.
SMAD4 and phosphorylated SMAD2 protein levels in fibroblasts harboring SMAD4 mutations. Western blot analysis and band intensity quantification revealed increased SMAD4 and phosphorylated SMAD2 (pSMAD2)/SMAD2 ratio in MS fibroblasts (MS1, MS2, MS3, and MS4) compared with healthy control cells (WT1 and WT2) in which SMAD4 and pSMAD2 were barely detectable. Cells from Marfan syndrome patient (MFS) also showed increased SMAD4 and pSMAD2/SMAD2 ratio.

