
Figure 2.
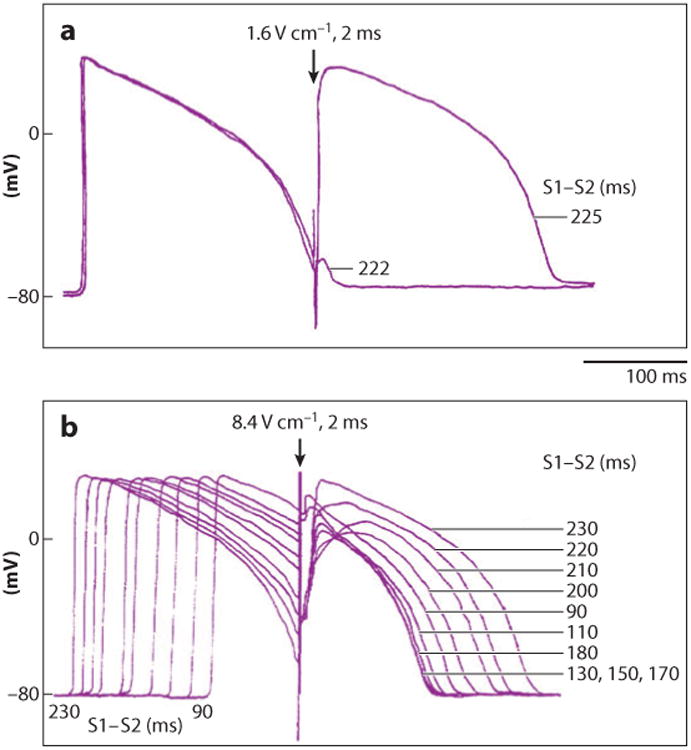
Varying strength and timing of shocks (S2) with respect to the previous electrical stimulus (S1) produce varying responses in recordings of transmembrane potential. (a) With a relatively weak shock field of 1.6 V cm−1, an all-or-nothing response is observed depending on the S1–S2 interval. With an S1–S2 interval of 222 ms, almost no response occurs. With an S1–S2 interval only 3 ms longer, 225 ms, a new action potential occurs. (b) A strong shock field of 8.4 V cm−1 during the plateau of an action potential produces a graded response that varies with the state of the cardiac cell when the shock was delivered. The S1–S2 interval was varied from 90 to 230 ms. The tracings are time aligned with the S2 shock (16).