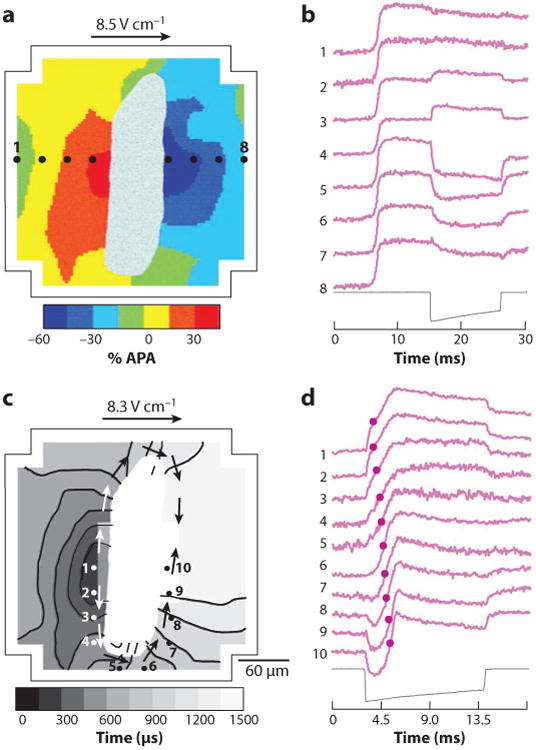
Figure 4.

Role of intercellular clefts in shock-induced ΔVm and tissue activation. (a) The shock-induced ΔVm surrounding a cleft in a myocyte monolayer follows the color scale on the bottom of the panel. White areas in the middle depict the intercellular cleft. The outline corresponds to the boundary of the photodiode array. APA, action potential amplitude. (b) Individual pixel recordings from sites 1–8 as shown in panel a with the shock waveform below. (c) Isochronal maps of activation spread initiated from secondary sources during application of shocks in diastole. The gray scale indicates the time of the isochronal lines. Arrows indicate the direction of activation spread. Activation times are determined from the time of earliest activation within the mapping region. (d) Individual pixel recordings from sites 1–10 from panel c. Activation times are shown with circles on the traces (31).
