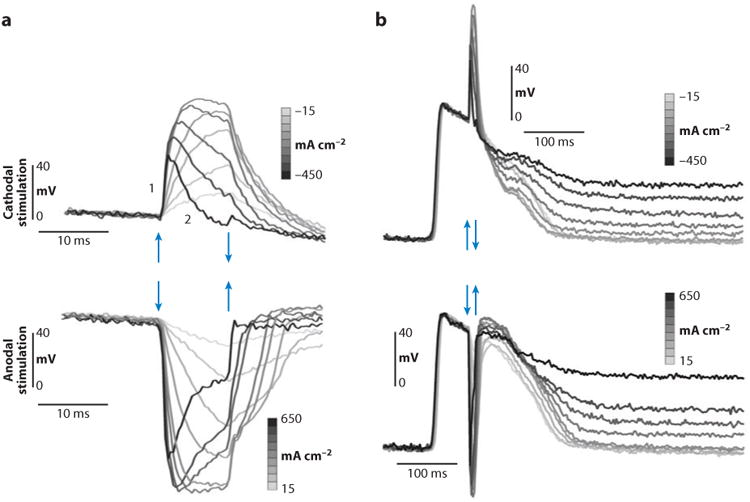
Figure 6.

Optical recording of ΔVm under a shocking electrode with different current densities. Arrows mark the beginning and end of the stimulus pulse. (a) Small timescale shows the nonmonotonic response of ΔVm to stimulus amplitude. (b) Large timescale shows elevation of the diastolic potential after the shock (38).
