
Figure 7.
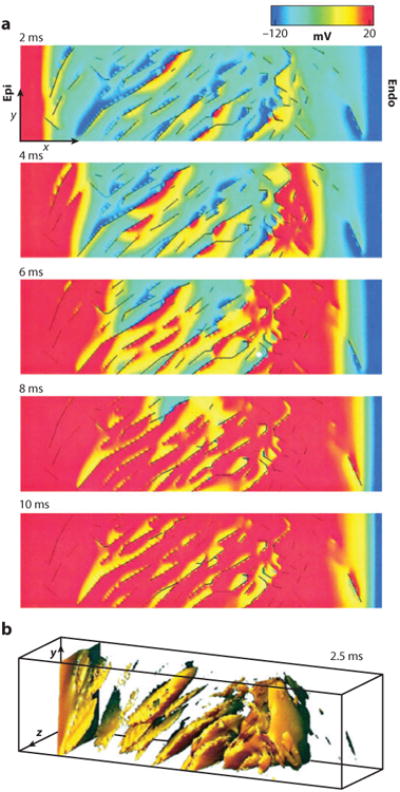
Computer simulation of a shock produces secondary sources in a model based on confocal microscopic images of ventricular rat tissue. (a) Progression of activation during a 10-ms shock. Transmembrane potentials of a single midvolume plane are shown according to the color scale at the top with cleavage plane discontinuities (black lines). Epi, epicardium; Endo, endocardium. (b) A three-dimensional view of secondary sources with transmembrane potentials greater than −60 mV at 2.5 ms into the shock (39).