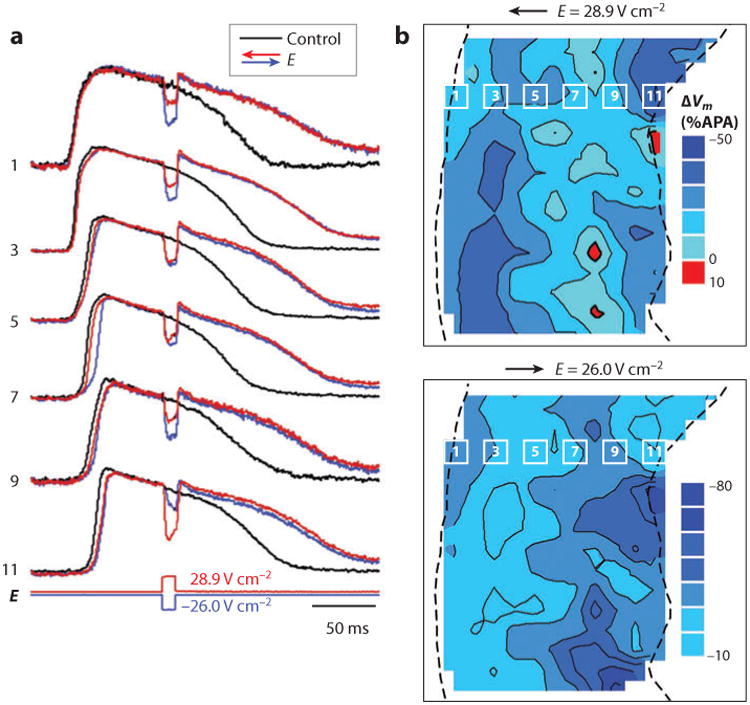
Figure 8.

Effects of shocks on intramural Vm in a porcine LV wedge preparation. (a) Optical recordings of Vm in control action potentials and during shock application. E, shock strength. The numbers correspond to the photodiodes indicated in panel b. (b) Isopotential maps of shock-induced ΔVm distribution measured at 9 ms after shock onset. The dashed lines indicate the epicardium on the left and the endocardium on the right (42). APA, action potential amplitude.
