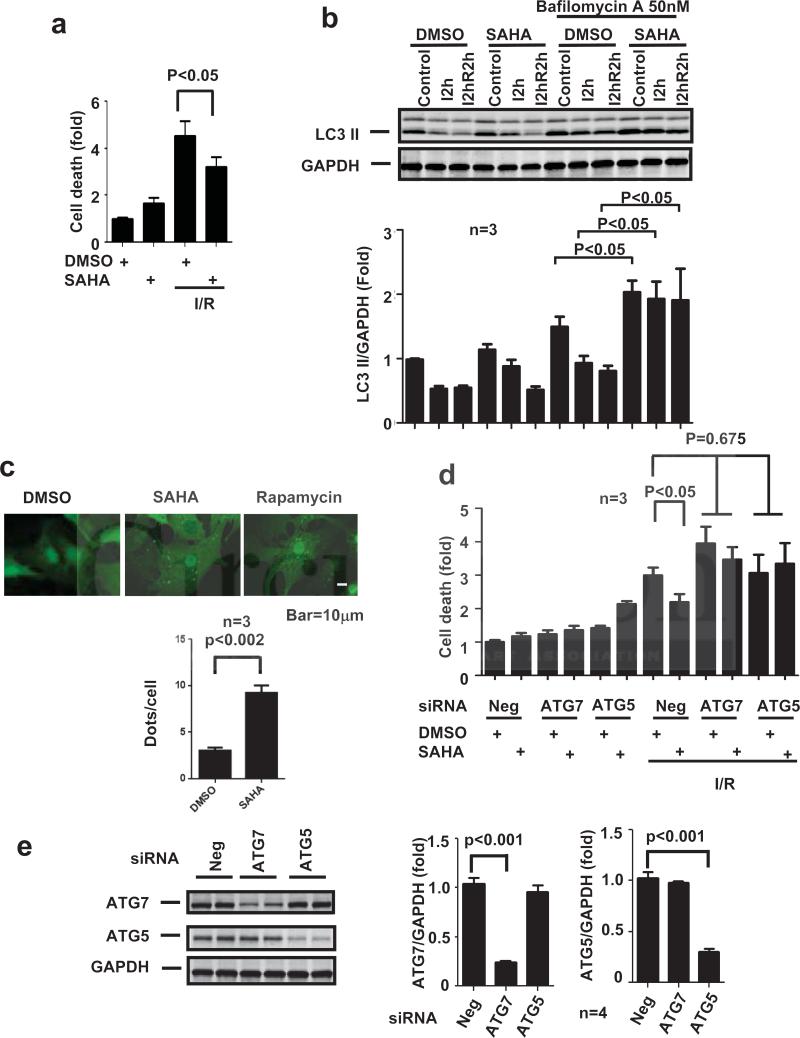
Figure 6.
SAHA regulates autophagic flux during I/R, and SAHA's cardioprotective effects are dependent on autophagic flux. a. LDH cell death assay. SAHA treatment (2μM) reduced cell death around 30% after simulated I/R (sI/R; 5 hour/1.5 hour) (n=3, p<0.05). b. Upper: LC3 Western blot. At steady state, LC3-II levels normalized to GAPDH decreased in both DMSO and SAHA groups after 2 hours of ischemia (I2h) and 2 hours of ischemia plus 2 hours of reperfusion (I2hR2h). However, after Bafilomycin A treatment, SAHA treatment induced increases in LC3II levels even after simulated I/R (n=3, p<0.05). b. Lower: Quantification. c. Autophagic flux measurement using adenovirus hosting GFP-LC3. SAHA treatment increased autophagic flux as evidenced by increased the GFP-LC3 puncta signal. d. LDH cell death assay in the settings of ATG7 or ATG5 knockdown. Suppression of ATG7 and ATG5 both abolished SAHA's cardioprotective effects after sI/R (5 hour/1.5 hour) (n=3, p<0.05). e. RNAi knockdown of ATG7 and ATG5. Left: Western blots. Right: quantification.

