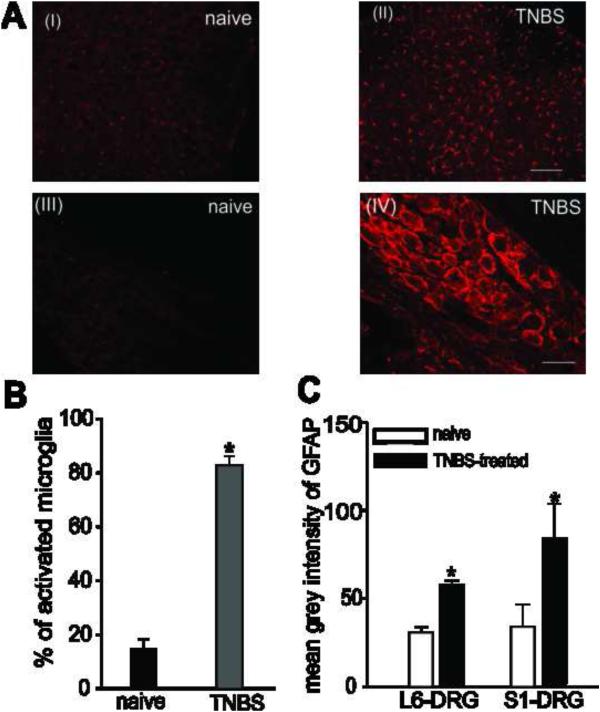
Fig.2.
Photomicrograph of Iba-1 positive stained microglial from the LS spinal cord and GFAP-ir SGCs from the L6 and S1 DRG from naïve and inflamed rats. The number of activated microglia was increased in the LS spinal cord of TNBS-treated rats (AII) post 7 days, when compared to naïve rats (AI). Scale bars represent 200 μm. Distribution of activated SGCs surrounding DRG neurons was determined by measuring the grey intensity of GFAP-ir SGCs. Intense GFAP-ir indicating activation of SGCs was seen around neurons from S1 DRGs post 7 days of TNBS treatment compared to naïve rats (AIII-IV). Scale bars represent 50μm. (B) Quantitative analysis showed that the number of activated microglia was found to be significantly (P<0.05) increased following TNBS-treated rats compared to naïve rats. Values expressed as mean % of activated cells ± S.E.M. (C) Similarly, the mean grey intensity indicating GFAP-ir was significantly higher in both L6 and S1 DRGs in TNBS-treated rats compared to naïve rats indicating activation of SGCs following inflammation of the colon. Values expressed as mean grey intensity of GFAP ± S.E.M. P<0.05 was considered significant. * compared with naïve rat.

