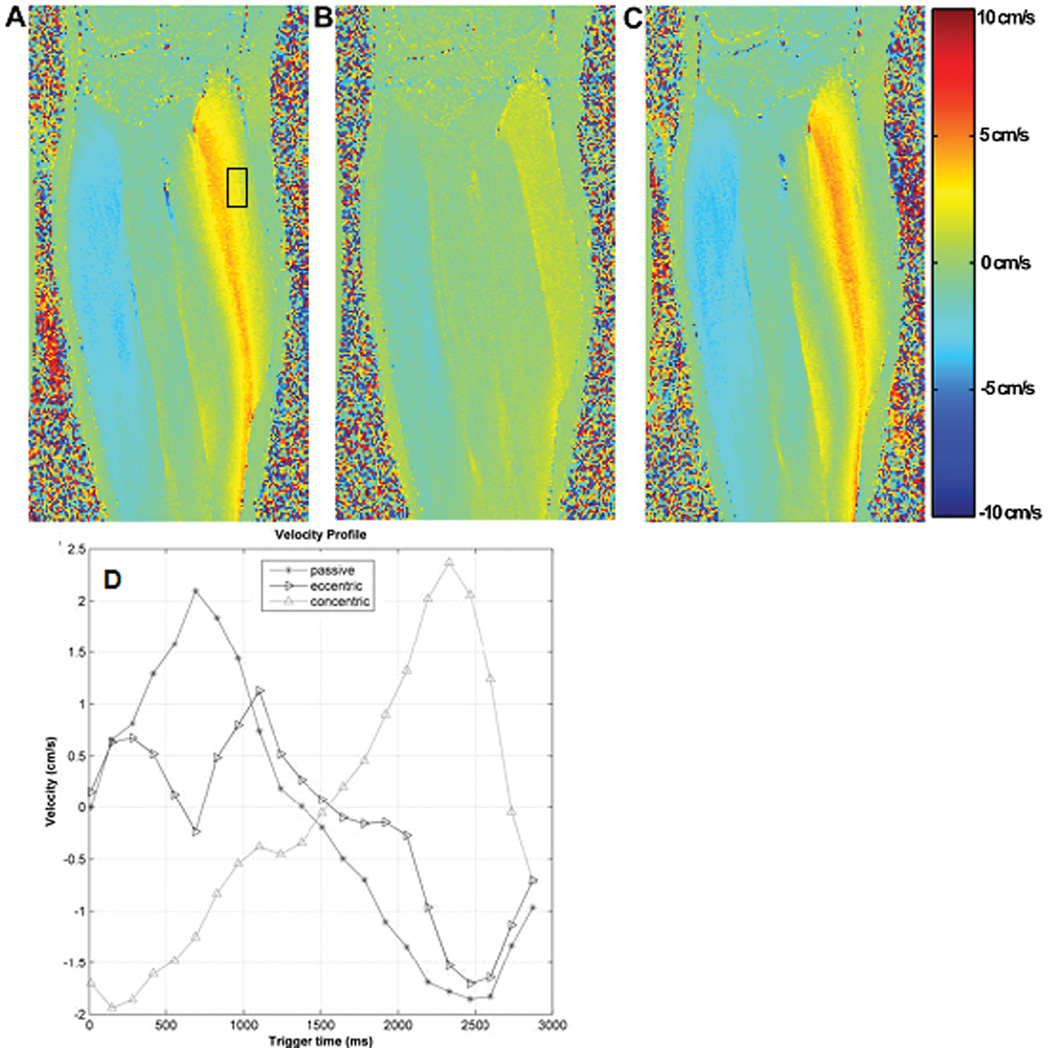
Fig. 3.
Velocity encoded phase contrast images acquired at 1.5T with the foot pedal device, with the ankle undergoing three different modes of dynamic ankle rotation: passive (A, curve in Fig. 3.D connected with circles), active eccentric (B, inverted triangles), and active concentric (C, triangles) contractions. Pixel intensity of the images shown represents velocity encoded in superior-inferior direction (positive: up, negative: down), with the maximum and minimum range of ± 10 cm/s (VENC), as shown in the adjacent color code bar. Fig. 3-A and C were acquired during the plantarflexion phase of the rotation cycle while B was taken during the dorsiflexion phase and all three denote the phase in which maximum velocity occurs. Characteristic distribution patterns of velocity for the three different contraction mode are clearly demonstrated. (D) Changes in the velocity of the medial gastrocnemius within the rectangular ROI shown in (A) with time during the three modes of dynamic ankle rotation. The velocity within the ROI was averaged at each phase of the rotation cycle. It is to be noted that while these data are from images acquired at 1.5T, physiologically similar data are obtained at higher field of 3T, albeit with a higher signal-to-noise ratio.

